
Despite posting some strong earnings, the market for E&R Engineering Corporation's (GTSM:8027) stock hasn't moved much. Our analysis suggests that this might be because shareholders have noticed some concerning underlying factors.
View our latest analysis for E&R Engineering
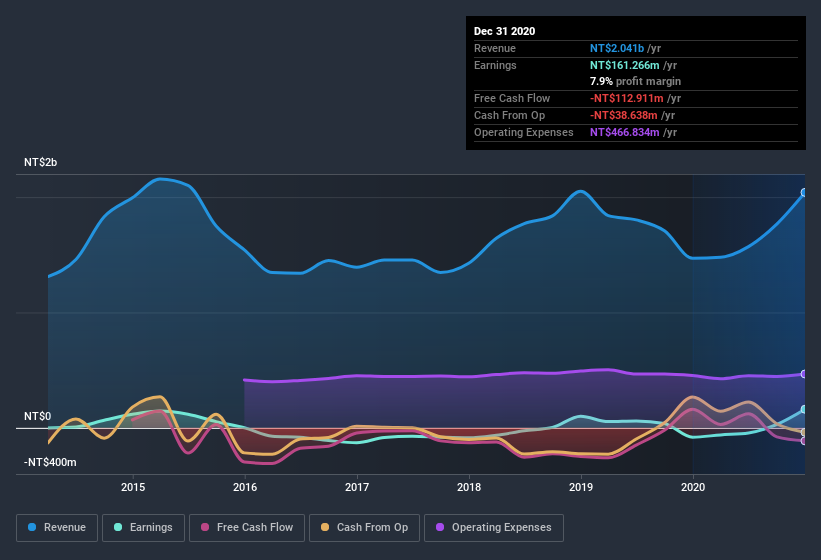
Examining Cashflow Against E&R Engineering's Earnings
As finance nerds would already know, the accrual ratio from cashflow is a key measure for assessing how well a company's free cash flow (FCF) matches its profit. In plain english, this ratio subtracts FCF from net profit, and divides that number by the company's average operating assets over that period. This ratio tells us how much of a company's profit is not backed by free cashflow.
Therefore, it's actually considered a good thing when a company has a negative accrual ratio, but a bad thing if its accrual ratio is positive. That is not intended to imply we should worry about a positive accrual ratio, but it's worth noting where the accrual ratio is rather high. That's because some academic studies have suggested that high accruals ratios tend to lead to lower profit or less profit growth.
Over the twelve months to December 2020, E&R Engineering recorded an accrual ratio of 0.22. Therefore, we know that it's free cashflow was significantly lower than its statutory profit, which is hardly a good thing. Even though it reported a profit of NT$161.3m, a look at free cash flow indicates it actually burnt through NT$113m in the last year. We saw that FCF was NT$160m a year ago though, so E&R Engineering has at least been able to generate positive FCF in the past. One positive for E&R Engineering shareholders is that it's accrual ratio was significantly better last year, providing reason to believe that it may return to stronger cash conversion in the future. Shareholders should look for improved cashflow relative to profit in the current year, if that is indeed the case.
Note: we always recommend investors check balance sheet strength. Click here to be taken to our balance sheet analysis of E&R Engineering.
Our Take On E&R Engineering's Profit Performance
E&R Engineering didn't convert much of its profit to free cash flow in the last year, which some investors may consider rather suboptimal. Because of this, we think that it may be that E&R Engineering's statutory profits are better than its underlying earnings power. The good news is that it earned a profit in the last twelve months, despite its previous loss. Of course, we've only just scratched the surface when it comes to analysing its earnings; one could also consider margins, forecast growth, and return on investment, among other factors. In light of this, if you'd like to do more analysis on the company, it's vital to be informed of the risks involved. Our analysis shows 2 warning signs for E&R Engineering (1 is potentially serious!) and we strongly recommend you look at these bad boys before investing.
Today we've zoomed in on a single data point to better understand the nature of E&R Engineering's profit. But there are plenty of other ways to inform your opinion of a company. For example, many people consider a high return on equity as an indication of favorable business economics, while others like to 'follow the money' and search out stocks that insiders are buying. So you may wish to see this free collection of companies boasting high return on equity, or this list of stocks that insiders are buying.
If you’re looking to trade E&R Engineering, open an account with the lowest-cost* platform trusted by professionals, Interactive Brokers. Their clients from over 200 countries and territories trade stocks, options, futures, forex, bonds and funds worldwide from a single integrated account. Promoted
The New Payments ETF Is Live on NASDAQ:
Money is moving to real-time rails, and a newly listed ETF now gives investors direct exposure. Fast settlement. Institutional custody. Simple access.
Explore how this launch could reshape portfolios
Sponsored ContentValuation is complex, but we're here to simplify it.
Discover if E&R Engineering might be undervalued or overvalued with our detailed analysis, featuring fair value estimates, potential risks, dividends, insider trades, and its financial condition.
Access Free AnalysisThis article by Simply Wall St is general in nature. It does not constitute a recommendation to buy or sell any stock, and does not take account of your objectives, or your financial situation. We aim to bring you long-term focused analysis driven by fundamental data. Note that our analysis may not factor in the latest price-sensitive company announcements or qualitative material. Simply Wall St has no position in any stocks mentioned.
*Interactive Brokers Rated Lowest Cost Broker by StockBrokers.com Annual Online Review 2020
Have feedback on this article? Concerned about the content? Get in touch with us directly. Alternatively, email editorial-team (at) simplywallst.com.
About TPEX:8027
E&R Engineering
Provides automation machines for semiconductor, light emitting diode (LED), passive component, material, and medical industries in Taiwan, Hong Kong, Mainland China, Southeast Asia, the United States, Europe, and internationally.
High growth potential with excellent balance sheet.
Market Insights

Weekly Picks

THE KINGDOM OF BROWN GOODS: WHY MGPI IS BEING CRUSHED BY INVENTORY & PRIMED FOR RESURRECTION


Why Vertical Aerospace (NYSE: EVTL) is Worth Possibly Over 13x its Current Price


The Quiet Giant That Became AI’s Power Grid
Recently Updated Narratives


A tech powerhouse quietly powering the world’s AI infrastructure.


Keppel DC REIT (SGX: AJBU) is a resilient gem in the data center space.
Why Vertical Aerospace (NYSE: EVTL) is Worth Possibly Over 13x its Current Price
Popular Narratives

MicroVision will explode future revenue by 380.37% with a vision towards success


Crazy Undervalued 42 Baggers Silver Play (Active & Running Mine)


