
Advertisement
Do Fundamentals Have Any Role To Play In Driving momo.com Inc.'s (TWSE:8454) Stock Up Recently?

momo.com's (TWSE:8454) stock up by 3.5% over the past week. We wonder if and what role the company's financials play in that price change as a company's long-term fundamentals usually dictate market outcomes. In this article, we decided to focus on momo.com's ROE.
ROE or return on equity is a useful tool to assess how effectively a company can generate returns on the investment it received from its shareholders. In short, ROE shows the profit each dollar generates with respect to its shareholder investments.
See our latest analysis for momo.com
How Is ROE Calculated?
Return on equity can be calculated by using the formula:
Return on Equity = Net Profit (from continuing operations) ÷ Shareholders' Equity
So, based on the above formula, the ROE for momo.com is:
42% = NT$3.6b ÷ NT$8.4b (Based on the trailing twelve months to June 2024).
The 'return' is the profit over the last twelve months. Another way to think of that is that for every NT$1 worth of equity, the company was able to earn NT$0.42 in profit.
What Is The Relationship Between ROE And Earnings Growth?
Thus far, we have learned that ROE measures how efficiently a company is generating its profits. We now need to evaluate how much profit the company reinvests or "retains" for future growth which then gives us an idea about the growth potential of the company. Generally speaking, other things being equal, firms with a high return on equity and profit retention, have a higher growth rate than firms that don’t share these attributes.
momo.com's Earnings Growth And 42% ROE
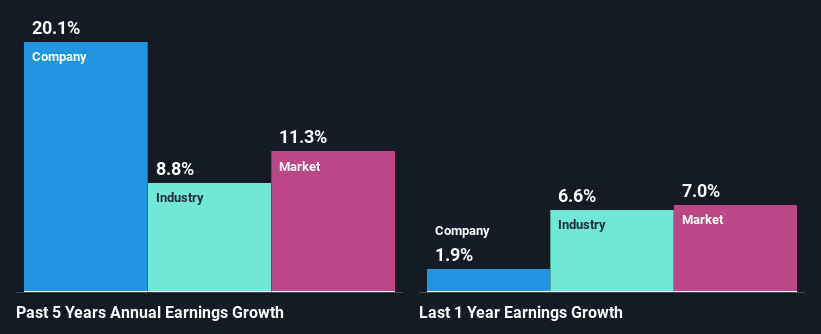
Firstly, we acknowledge that momo.com has a significantly high ROE. Secondly, even when compared to the industry average of 13% the company's ROE is quite impressive. So, the substantial 20% net income growth seen by momo.com over the past five years isn't overly surprising.
As a next step, we compared momo.com's net income growth with the industry, and pleasingly, we found that the growth seen by the company is higher than the average industry growth of 8.8%.
Earnings growth is an important metric to consider when valuing a stock. It’s important for an investor to know whether the market has priced in the company's expected earnings growth (or decline). By doing so, they will have an idea if the stock is headed into clear blue waters or if swampy waters await. Is 8454 fairly valued? This infographic on the company's intrinsic value has everything you need to know.
Is momo.com Using Its Retained Earnings Effectively?
momo.com has a significant three-year median payout ratio of 93%, meaning the company only retains 6.6% of its income. This implies that the company has been able to achieve high earnings growth despite returning most of its profits to shareholders.
Besides, momo.com has been paying dividends for at least ten years or more. This shows that the company is committed to sharing profits with its shareholders. Our latest analyst data shows that the future payout ratio of the company is expected to drop to 72% over the next three years. Regardless, the future ROE for momo.com is predicted to decline to 34% despite the anticipated decrease in the payout ratio. We reckon that there could probably be other factors that could be driving the forseen decline in the company's ROE.
Summary
Overall, we feel that momo.com certainly does have some positive factors to consider. Specifically, its high ROE which likely led to the growth in earnings. Bear in mind, the company reinvests little to none of its profits, which means that investors aren't necessarily reaping the full benefits of the high rate of return. With that said, the latest industry analyst forecasts reveal that the company's earnings growth is expected to slow down. To know more about the company's future earnings growth forecasts take a look at this free report on analyst forecasts for the company to find out more.
New: AI Stock Screener & Alerts
Our new AI Stock Screener scans the market every day to uncover opportunities.
• Dividend Powerhouses (3%+ Yield)
• Undervalued Small Caps with Insider Buying
• High growth Tech and AI Companies
Or build your own from over 50 metrics.
Have feedback on this article? Concerned about the content? Get in touch with us directly. Alternatively, email editorial-team (at) simplywallst.com.
This article by Simply Wall St is general in nature. We provide commentary based on historical data and analyst forecasts only using an unbiased methodology and our articles are not intended to be financial advice. It does not constitute a recommendation to buy or sell any stock, and does not take account of your objectives, or your financial situation. We aim to bring you long-term focused analysis driven by fundamental data. Note that our analysis may not factor in the latest price-sensitive company announcements or qualitative material. Simply Wall St has no position in any stocks mentioned.
About TWSE:8454
momo.com
Engages in the TV and radio production, radio and TV program distribution, radio and TV commercial, video program distribution, issuing of magazine, and retailing businesses in Taiwan.
Excellent balance sheet and fair value.
Similar Companies
Market Insights


Advertisement
Community Narratives
Pole position to benefit from GENIUS Act
Fair Value US$233.04|59.1% undervalued
CH
Community Contributor
IREN will transform from bitcoin miner to leader in AI infrastructure
Fair Value US$21.48|15.5% undervalued
KA
Community Contributor
Behind the Assay: XRF Scientific’s Role in Modern Mining Economics
Fair Value AU$2.10|2.4% undervalued
RO
Community Contributor