Will Tonlin Department StoreLtd (TPE:2910) Multiply In Value Going Forward?

If you're not sure where to start when looking for the next multi-bagger, there are a few key trends you should keep an eye out for. Amongst other things, we'll want to see two things; firstly, a growing return on capital employed (ROCE) and secondly, an expansion in the company's amount of capital employed. If you see this, it typically means it's a company with a great business model and plenty of profitable reinvestment opportunities. However, after investigating Tonlin Department StoreLtd (TPE:2910), we don't think it's current trends fit the mold of a multi-bagger.
Return On Capital Employed (ROCE): What is it?
For those who don't know, ROCE is a measure of a company's yearly pre-tax profit (its return), relative to the capital employed in the business. Analysts use this formula to calculate it for Tonlin Department StoreLtd:
Return on Capital Employed = Earnings Before Interest and Tax (EBIT) ÷ (Total Assets - Current Liabilities)
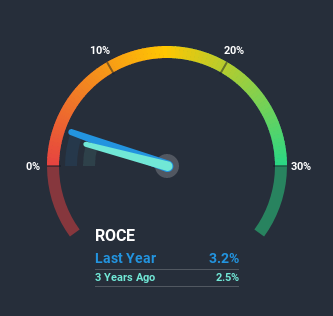
0.032 = NT$153m ÷ (NT$6.2b - NT$1.5b) (Based on the trailing twelve months to September 2020).
So, Tonlin Department StoreLtd has an ROCE of 3.2%. Ultimately, that's a low return and it under-performs the Multiline Retail industry average of 5.1%.
View our latest analysis for Tonlin Department StoreLtd
While the past is not representative of the future, it can be helpful to know how a company has performed historically, which is why we have this chart above. If you're interested in investigating Tonlin Department StoreLtd's past further, check out this free graph of past earnings, revenue and cash flow.
What Does the ROCE Trend For Tonlin Department StoreLtd Tell Us?
There are better returns on capital out there than what we're seeing at Tonlin Department StoreLtd. The company has consistently earned 3.2% for the last five years, and the capital employed within the business has risen 36% in that time. Given the company has increased the amount of capital employed, it appears the investments that have been made simply don't provide a high return on capital.
On a side note, Tonlin Department StoreLtd has done well to reduce current liabilities to 24% of total assets over the last five years. This can eliminate some of the risks inherent in the operations because the business has less outstanding obligations to their suppliers and or short-term creditors than they did previously.
What We Can Learn From Tonlin Department StoreLtd's ROCE
Long story short, while Tonlin Department StoreLtd has been reinvesting its capital, the returns that it's generating haven't increased. Since the stock has gained an impressive 66% over the last five years, investors must think there's better things to come. Ultimately, if the underlying trends persist, we wouldn't hold our breath on it being a multi-bagger going forward.
If you'd like to know more about Tonlin Department StoreLtd, we've spotted 2 warning signs, and 1 of them makes us a bit uncomfortable.
If you want to search for solid companies with great earnings, check out this free list of companies with good balance sheets and impressive returns on equity.
If you’re looking to trade Tonlin Department StoreLtd, open an account with the lowest-cost* platform trusted by professionals, Interactive Brokers. Their clients from over 200 countries and territories trade stocks, options, futures, forex, bonds and funds worldwide from a single integrated account. Promoted
Mobile Infrastructure for Defense and Disaster
The next wave in robotics isn't humanoid. Its fully autonomous towers delivering 5G, ISR, and radar in under 30 minutes, anywhere.
Get the investor briefing before the next round of contracts
Sponsored On Behalf of CiTechValuation is complex, but we're here to simplify it.
Discover if Tonlin Department StoreLtd might be undervalued or overvalued with our detailed analysis, featuring fair value estimates, potential risks, dividends, insider trades, and its financial condition.
Access Free AnalysisThis article by Simply Wall St is general in nature. It does not constitute a recommendation to buy or sell any stock, and does not take account of your objectives, or your financial situation. We aim to bring you long-term focused analysis driven by fundamental data. Note that our analysis may not factor in the latest price-sensitive company announcements or qualitative material. Simply Wall St has no position in any stocks mentioned.
*Interactive Brokers Rated Lowest Cost Broker by StockBrokers.com Annual Online Review 2020
Have feedback on this article? Concerned about the content? Get in touch with us directly. Alternatively, email editorial-team (at) simplywallst.com.
About TWSE:2910
Proven track record average dividend payer.
Market Insights

Weekly Picks

THE KINGDOM OF BROWN GOODS: WHY MGPI IS BEING CRUSHED BY INVENTORY & PRIMED FOR RESURRECTION


Why Vertical Aerospace (NYSE: EVTL) is Worth Possibly Over 13x its Current Price


The Quiet Giant That Became AI’s Power Grid
Recently Updated Narratives

Butler National (Buks) outperforms.


A tech powerhouse quietly powering the world’s AI infrastructure.


Keppel DC REIT (SGX: AJBU) is a resilient gem in the data center space.
Popular Narratives

MicroVision will explode future revenue by 380.37% with a vision towards success


Crazy Undervalued 42 Baggers Silver Play (Active & Running Mine)


