
Advertisement
What Universal Textile Co., Ltd.'s (TWSE:1445) 29% Share Price Gain Is Not Telling You
Universal Textile Co., Ltd. (TWSE:1445) shareholders have had their patience rewarded with a 29% share price jump in the last month. Looking back a bit further, it's encouraging to see the stock is up 70% in the last year.
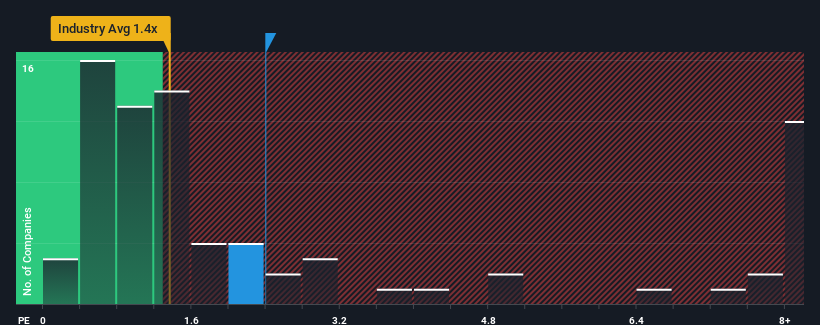
Since its price has surged higher, when almost half of the companies in Taiwan's Luxury industry have price-to-sales ratios (or "P/S") below 1.4x, you may consider Universal Textile as a stock probably not worth researching with its 2.4x P/S ratio. Although, it's not wise to just take the P/S at face value as there may be an explanation why it's as high as it is.
Check out our latest analysis for Universal Textile
What Does Universal Textile's Recent Performance Look Like?
We'd have to say that with no tangible growth over the last year, Universal Textile's revenue has been unimpressive. It might be that many are expecting an improvement to the uninspiring revenue performance over the coming period, which has kept the P/S from collapsing. However, if this isn't the case, investors might get caught out paying too much for the stock.
Although there are no analyst estimates available for Universal Textile, take a look at this free data-rich visualisation to see how the company stacks up on earnings, revenue and cash flow.What Are Revenue Growth Metrics Telling Us About The High P/S?
The only time you'd be truly comfortable seeing a P/S as high as Universal Textile's is when the company's growth is on track to outshine the industry.
Taking a look back first, we see that there was hardly any revenue growth to speak of for the company over the past year. Although pleasingly revenue has lifted 42% in aggregate from three years ago, notwithstanding the last 12 months. Accordingly, shareholders will be pleased, but also have some questions to ponder about the last 12 months.
Comparing that to the industry, which is predicted to deliver 11% growth in the next 12 months, the company's momentum is pretty similar based on recent medium-term annualised revenue results.
With this information, we find it interesting that Universal Textile is trading at a high P/S compared to the industry. Apparently many investors in the company are more bullish than recent times would indicate and aren't willing to let go of their stock right now. Although, additional gains will be difficult to achieve as a continuation of recent revenue trends would weigh down the share price eventually.
What We Can Learn From Universal Textile's P/S?
The large bounce in Universal Textile's shares has lifted the company's P/S handsomely. Using the price-to-sales ratio alone to determine if you should sell your stock isn't sensible, however it can be a practical guide to the company's future prospects.
Our look into Universal Textile has shown that it currently trades on a higher than expected P/S since its recent three-year growth is only in line with the wider industry forecast. When we see average revenue with industry-like growth combined with a high P/S, we suspect the share price is at risk of declining, bringing the P/S back in line with the industry too. Unless there is a significant improvement in the company's medium-term trends, it will be difficult to prevent the P/S ratio from declining to a more reasonable level.
The company's balance sheet is another key area for risk analysis. Take a look at our free balance sheet analysis for Universal Textile with six simple checks on some of these key factors.
If you're unsure about the strength of Universal Textile's business, why not explore our interactive list of stocks with solid business fundamentals for some other companies you may have missed.
New: AI Stock Screener & Alerts
Our new AI Stock Screener scans the market every day to uncover opportunities.
• Dividend Powerhouses (3%+ Yield)
• Undervalued Small Caps with Insider Buying
• High growth Tech and AI Companies
Or build your own from over 50 metrics.
Have feedback on this article? Concerned about the content? Get in touch with us directly. Alternatively, email editorial-team (at) simplywallst.com.
This article by Simply Wall St is general in nature. We provide commentary based on historical data and analyst forecasts only using an unbiased methodology and our articles are not intended to be financial advice. It does not constitute a recommendation to buy or sell any stock, and does not take account of your objectives, or your financial situation. We aim to bring you long-term focused analysis driven by fundamental data. Note that our analysis may not factor in the latest price-sensitive company announcements or qualitative material. Simply Wall St has no position in any stocks mentioned.
About TWSE:1445
Universal Textile
Manufactures and sells various processed yarns and synthetic fiber fabrics in Taiwan.
Low risk unattractive dividend payer.
Similar Companies
Market Insights

Advertisement
Community Narratives
A formidable player in AI and enterprise computing.
Fair Value US$210.00|12.2% overvalued
CO
Community Contributor
IREN's Bold Moves in Sustainable Bitcoin Mining & AI Data Centers
Fair Value US$72.52|17.1% undervalued
BL
Community Contributor
Cooling the Champions: The Aussie Tech Behind F1's Victories
Fair Value AU$12.40|38.7% undervalued
TR
Community Contributor