- Taiwan
- /
- Commercial Services
- /
- TWSE:6139
Are Investors Concerned With What's Going On At L&K Engineering (TPE:6139)?

To avoid investing in a business that's in decline, there's a few financial metrics that can provide early indications of aging. More often than not, we'll see a declining return on capital employed (ROCE) and a declining amount of capital employed. This indicates the company is producing less profit from its investments and its total assets are decreasing. So after we looked into L&K Engineering (TPE:6139), the trends above didn't look too great.
Return On Capital Employed (ROCE): What is it?
If you haven't worked with ROCE before, it measures the 'return' (pre-tax profit) a company generates from capital employed in its business. To calculate this metric for L&K Engineering, this is the formula:
Return on Capital Employed = Earnings Before Interest and Tax (EBIT) ÷ (Total Assets - Current Liabilities)
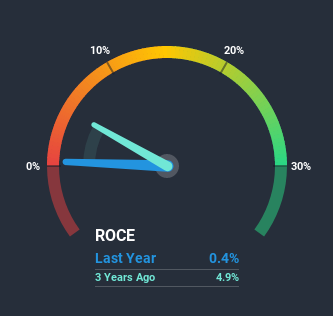
0.0038 = NT$52m ÷ (NT$29b - NT$16b) (Based on the trailing twelve months to September 2020).
Thus, L&K Engineering has an ROCE of 0.4%. Ultimately, that's a low return and it under-performs the Commercial Services industry average of 5.0%.
See our latest analysis for L&K Engineering
In the above chart we have measured L&K Engineering's prior ROCE against its prior performance, but the future is arguably more important. If you'd like to see what analysts are forecasting going forward, you should check out our free report for L&K Engineering.
What The Trend Of ROCE Can Tell Us
In terms of L&K Engineering's historical ROCE movements, the trend doesn't inspire confidence. To be more specific, the ROCE was 3.3% five years ago, but since then it has dropped noticeably. Meanwhile, capital employed in the business has stayed roughly the flat over the period. Since returns are falling and the business has the same amount of assets employed, this can suggest it's a mature business that hasn't had much growth in the last five years. If these trends continue, we wouldn't expect L&K Engineering to turn into a multi-bagger.
On a separate but related note, it's important to know that L&K Engineering has a current liabilities to total assets ratio of 54%, which we'd consider pretty high. This effectively means that suppliers (or short-term creditors) are funding a large portion of the business, so just be aware that this can introduce some elements of risk. While it's not necessarily a bad thing, it can be beneficial if this ratio is lower.Our Take On L&K Engineering's ROCE
All in all, the lower returns from the same amount of capital employed aren't exactly signs of a compounding machine. Since the stock has skyrocketed 124% over the last five years, it looks like investors have high expectations of the stock. In any case, the current underlying trends don't bode well for long term performance so unless they reverse, we'd start looking elsewhere.
One final note, you should learn about the 4 warning signs we've spotted with L&K Engineering (including 1 which makes us a bit uncomfortable) .
While L&K Engineering isn't earning the highest return, check out this free list of companies that are earning high returns on equity with solid balance sheets.
When trading L&K Engineering or any other investment, use the platform considered by many to be the Professional's Gateway to the Worlds Market, Interactive Brokers. You get the lowest-cost* trading on stocks, options, futures, forex, bonds and funds worldwide from a single integrated account. Promoted
Mobile Infrastructure for Defense and Disaster
The next wave in robotics isn't humanoid. Its fully autonomous towers delivering 5G, ISR, and radar in under 30 minutes, anywhere.
Get the investor briefing before the next round of contracts
Sponsored On Behalf of CiTechNew: AI Stock Screener & Alerts
Our new AI Stock Screener scans the market every day to uncover opportunities.
• Dividend Powerhouses (3%+ Yield)
• Undervalued Small Caps with Insider Buying
• High growth Tech and AI Companies
Or build your own from over 50 metrics.
This article by Simply Wall St is general in nature. It does not constitute a recommendation to buy or sell any stock, and does not take account of your objectives, or your financial situation. We aim to bring you long-term focused analysis driven by fundamental data. Note that our analysis may not factor in the latest price-sensitive company announcements or qualitative material. Simply Wall St has no position in any stocks mentioned.
*Interactive Brokers Rated Lowest Cost Broker by StockBrokers.com Annual Online Review 2020
Have feedback on this article? Concerned about the content? Get in touch with us directly. Alternatively, email editorial-team (at) simplywallst.com.
About TWSE:6139
L&K Engineering
Provides turnkey engineering services in Taiwan, Hongkong, and internationally.
Flawless balance sheet with proven track record and pays a dividend.
Similar Companies
Market Insights

Weekly Picks

Early mover in a fast growing industry. Likely to experience share price volatility as they scale


A case for CA$31.80 (undiluted), aka 8,616% upside from CA$0.37 (an 86 bagger!).


Moderation and Stabilisation: HOLD: Fair Price based on a 4-year Cycle is $12.08
Recently Updated Narratives

Amazon: Why the World’s Biggest Platform Still Runs on Invisible Economics

Sunrun Stock: When the Energy Transition Collides With the Cost of Capital

Salesforce Stock: AI-Fueled Growth Is Real — But Can Margins Stay This Strong?
Popular Narratives


MicroVision will explode future revenue by 380.37% with a vision towards success


Crazy Undervalued 42 Baggers Silver Play (Active & Running Mine)


