- Taiwan
- /
- Electrical
- /
- TWSE:1603
Did You Participate In Any Of China Wire & Cable's (TPE:1603) Fantastic 111% Return ?


The main point of investing for the long term is to make money. Furthermore, you'd generally like to see the share price rise faster than the market Unfortunately for shareholders, while the China Wire & Cable Co., Ltd. (TPE:1603) share price is up 52% in the last five years, that's less than the market return. Zooming in, the stock is actually down 12% in the last year.
Check out our latest analysis for China Wire & Cable
While markets are a powerful pricing mechanism, share prices reflect investor sentiment, not just underlying business performance. One way to examine how market sentiment has changed over time is to look at the interaction between a company's share price and its earnings per share (EPS).
During five years of share price growth, China Wire & Cable actually saw its EPS drop 1.4% per year.
So it's hard to argue that the earnings per share are the best metric to judge the company, as it may not be optimized for profits at this point. Since the change in EPS doesn't seem to correlate with the change in share price, it's worth taking a look at other metrics.
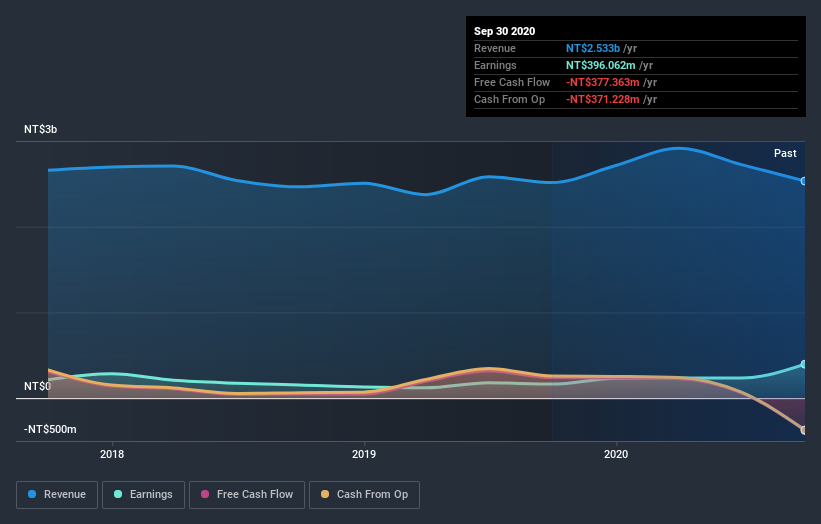
The modest 1.8% dividend yield is unlikely to be propping up the share price. It is not great to see that revenue has dropped by 2.9% per year over five years. It certainly surprises us that the share price is up, but perhaps a closer examination of the data will yield answers.
The company's revenue and earnings (over time) are depicted in the image below (click to see the exact numbers).
This free interactive report on China Wire & Cable's balance sheet strength is a great place to start, if you want to investigate the stock further.
What About Dividends?
As well as measuring the share price return, investors should also consider the total shareholder return (TSR). Whereas the share price return only reflects the change in the share price, the TSR includes the value of dividends (assuming they were reinvested) and the benefit of any discounted capital raising or spin-off. Arguably, the TSR gives a more comprehensive picture of the return generated by a stock. As it happens, China Wire & Cable's TSR for the last 5 years was 111%, which exceeds the share price return mentioned earlier. This is largely a result of its dividend payments!
A Different Perspective
Investors in China Wire & Cable had a tough year, with a total loss of 10% (including dividends), against a market gain of about 49%. Even the share prices of good stocks drop sometimes, but we want to see improvements in the fundamental metrics of a business, before getting too interested. Longer term investors wouldn't be so upset, since they would have made 16%, each year, over five years. It could be that the recent sell-off is an opportunity, so it may be worth checking the fundamental data for signs of a long term growth trend. It's always interesting to track share price performance over the longer term. But to understand China Wire & Cable better, we need to consider many other factors. Like risks, for instance. Every company has them, and we've spotted 2 warning signs for China Wire & Cable (of which 1 makes us a bit uncomfortable!) you should know about.
But note: China Wire & Cable may not be the best stock to buy. So take a peek at this free list of interesting companies with past earnings growth (and further growth forecast).
Please note, the market returns quoted in this article reflect the market weighted average returns of stocks that currently trade on TW exchanges.
If you’re looking to trade China Wire & Cable, open an account with the lowest-cost* platform trusted by professionals, Interactive Brokers. Their clients from over 200 countries and territories trade stocks, options, futures, forex, bonds and funds worldwide from a single integrated account. Promoted
If you're looking to trade China Wire & Cable, open an account with the lowest-cost platform trusted by professionals, Interactive Brokers.
With clients in over 200 countries and territories, and access to 160 markets, IBKR lets you trade stocks, options, futures, forex, bonds and funds from a single integrated account.
Enjoy no hidden fees, no account minimums, and FX conversion rates as low as 0.03%, far better than what most brokers offer.
Sponsored ContentNew: AI Stock Screener & Alerts
Our new AI Stock Screener scans the market every day to uncover opportunities.
• Dividend Powerhouses (3%+ Yield)
• Undervalued Small Caps with Insider Buying
• High growth Tech and AI Companies
Or build your own from over 50 metrics.
This article by Simply Wall St is general in nature. It does not constitute a recommendation to buy or sell any stock, and does not take account of your objectives, or your financial situation. We aim to bring you long-term focused analysis driven by fundamental data. Note that our analysis may not factor in the latest price-sensitive company announcements or qualitative material. Simply Wall St has no position in any stocks mentioned.
*Interactive Brokers Rated Lowest Cost Broker by StockBrokers.com Annual Online Review 2020
Have feedback on this article? Concerned about the content? Get in touch with us directly. Alternatively, email editorial-team (at) simplywallst.com.
About TWSE:1603
China Wire & Cable
Engages in the production, processing, installation, and sales services of wires and cables, aluminum doors and windows, curtain walls, and various aluminum products in Taiwan.
Excellent balance sheet and good value.
Market Insights

Community Narratives


