
Advertisement
- Taiwan
- /
- Electrical
- /
- TPEX:6292
Is Axis Corporation's (GTSM:6292) Recent Stock Performance Influenced By Its Financials In Any Way?

Axis' (GTSM:6292) stock up by 5.4% over the past three months. Given that stock prices are usually aligned with a company's financial performance in the long-term, we decided to investigate if the company's decent financials had a hand to play in the recent price move. Particularly, we will be paying attention to Axis' ROE today.
Return on Equity or ROE is a test of how effectively a company is growing its value and managing investors’ money. In simpler terms, it measures the profitability of a company in relation to shareholder's equity.
See our latest analysis for Axis
How To Calculate Return On Equity?
The formula for return on equity is:
Return on Equity = Net Profit (from continuing operations) ÷ Shareholders' Equity
So, based on the above formula, the ROE for Axis is:
14% = NT$131m ÷ NT$906m (Based on the trailing twelve months to September 2020).
The 'return' is the income the business earned over the last year. So, this means that for every NT$1 of its shareholder's investments, the company generates a profit of NT$0.14.
Why Is ROE Important For Earnings Growth?
Thus far, we have learned that ROE measures how efficiently a company is generating its profits. Depending on how much of these profits the company reinvests or "retains", and how effectively it does so, we are then able to assess a company’s earnings growth potential. Assuming all else is equal, companies that have both a higher return on equity and higher profit retention are usually the ones that have a higher growth rate when compared to companies that don't have the same features.
Axis' Earnings Growth And 14% ROE
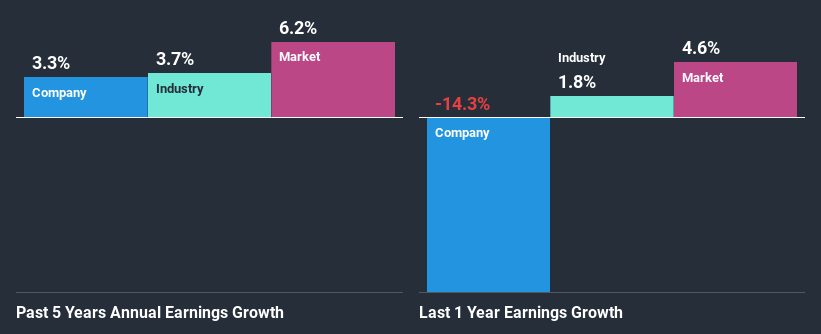
At first glance, Axis seems to have a decent ROE. On comparing with the average industry ROE of 7.9% the company's ROE looks pretty remarkable. However, for some reason, the higher returns aren't reflected in Axis' meagre five year net income growth average of 3.3%. That's a bit unexpected from a company which has such a high rate of return. A few likely reasons why this could happen is that the company could have a high payout ratio or the business has allocated capital poorly, for instance.
We then performed a comparison between Axis' net income growth with the industry, which revealed that the company's growth is similar to the average industry growth of 3.7% in the same period.
Earnings growth is an important metric to consider when valuing a stock. What investors need to determine next is if the expected earnings growth, or the lack of it, is already built into the share price. By doing so, they will have an idea if the stock is headed into clear blue waters or if swampy waters await. Is Axis fairly valued compared to other companies? These 3 valuation measures might help you decide.
Is Axis Efficiently Re-investing Its Profits?
Axis has a three-year median payout ratio of 91% (implying that it keeps only 9.3% of its profits), meaning that it pays out most of its profits to shareholders as dividends, and as a result, the company has seen low earnings growth.
Additionally, Axis has paid dividends over a period of at least ten years, which means that the company's management is determined to pay dividends even if it means little to no earnings growth.
Conclusion
On the whole, we do feel that Axis has some positive attributes. The company has grown its earnings moderately as a result of its impressive ROE. Yet, the business is retaining hardly any of its profits. This might have negative implications on the company's future growth. While we won't completely dismiss the company, what we would do, is try to ascertain how risky the business is to make a more informed decision around the company. To know the 3 risks we have identified for Axis visit our risks dashboard for free.
If you decide to trade Axis, use the lowest-cost* platform that is rated #1 Overall by Barron’s, Interactive Brokers. Trade stocks, options, futures, forex, bonds and funds on 135 markets, all from a single integrated account. Promoted
New: Manage All Your Stock Portfolios in One Place
We've created the ultimate portfolio companion for stock investors, and it's free.
• Connect an unlimited number of Portfolios and see your total in one currency
• Be alerted to new Warning Signs or Risks via email or mobile
• Track the Fair Value of your stocks
This article by Simply Wall St is general in nature. It does not constitute a recommendation to buy or sell any stock, and does not take account of your objectives, or your financial situation. We aim to bring you long-term focused analysis driven by fundamental data. Note that our analysis may not factor in the latest price-sensitive company announcements or qualitative material. Simply Wall St has no position in any stocks mentioned.
*Interactive Brokers Rated Lowest Cost Broker by StockBrokers.com Annual Online Review 2020
Have feedback on this article? Concerned about the content? Get in touch with us directly. Alternatively, email editorial-team (at) simplywallst.com.
About TPEX:6292
Axis
Engages in the manufacture, process, trade, and import and export of appliances and related peripheral parts in Taiwan.
Flawless balance sheet, good value and pays a dividend.
Market Insights

Advertisement
Community Narratives
RIO is poised to weather a depressed iron ore environment, but commodity diversification comes with lower margins
Fair Value AU$110.51|4.0% overvalued
DU
Community Contributor
The demand for personalized medicine will keep Thermo Fisher Scientific thriving
Fair Value US$540.27|21.0% undervalued
UN
Community Contributor
Silver Play by A Family with 10x Potential
Fair Value UK£24.00|88.7% undervalued
RO
Community Contributor