Singapore Telecommunications (SGX:Z74) investors are sitting on a loss of 7.9% if they invested five years ago

The main aim of stock picking is to find the market-beating stocks. But every investor is virtually certain to have both over-performing and under-performing stocks. At this point some shareholders may be questioning their investment in Singapore Telecommunications Limited (SGX:Z74), since the last five years saw the share price fall 26%.
With that in mind, it's worth seeing if the company's underlying fundamentals have been the driver of long term performance, or if there are some discrepancies.
View our latest analysis for Singapore Telecommunications
To paraphrase Benjamin Graham: Over the short term the market is a voting machine, but over the long term it's a weighing machine. One flawed but reasonable way to assess how sentiment around a company has changed is to compare the earnings per share (EPS) with the share price.
During the five years over which the share price declined, Singapore Telecommunications' earnings per share (EPS) dropped by 24% each year. This fall in the EPS is worse than the 6% compound annual share price fall. The relatively muted share price reaction might be because the market expects the business to turn around. The high P/E ratio of 52.97 suggests that shareholders believe earnings will grow in the years ahead.
You can see how EPS has changed over time in the image below (click on the chart to see the exact values).
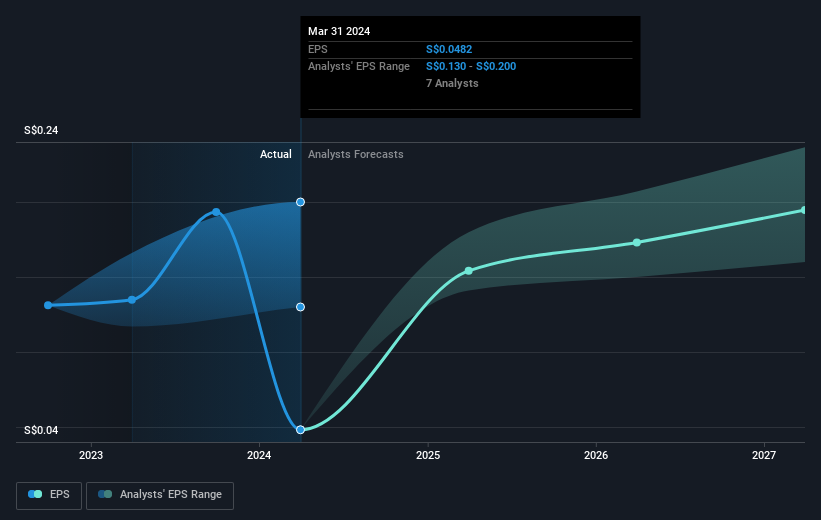
It's probably worth noting that the CEO is paid less than the median at similar sized companies. But while CEO remuneration is always worth checking, the really important question is whether the company can grow earnings going forward. Dive deeper into the earnings by checking this interactive graph of Singapore Telecommunications' earnings, revenue and cash flow.
What About Dividends?
It is important to consider the total shareholder return, as well as the share price return, for any given stock. Whereas the share price return only reflects the change in the share price, the TSR includes the value of dividends (assuming they were reinvested) and the benefit of any discounted capital raising or spin-off. Arguably, the TSR gives a more comprehensive picture of the return generated by a stock. We note that for Singapore Telecommunications the TSR over the last 5 years was -7.9%, which is better than the share price return mentioned above. The dividends paid by the company have thusly boosted the total shareholder return.
A Different Perspective
It's good to see that Singapore Telecommunications has rewarded shareholders with a total shareholder return of 6.2% in the last twelve months. Of course, that includes the dividend. There's no doubt those recent returns are much better than the TSR loss of 1.5% per year over five years. We generally put more weight on the long term performance over the short term, but the recent improvement could hint at a (positive) inflection point within the business. I find it very interesting to look at share price over the long term as a proxy for business performance. But to truly gain insight, we need to consider other information, too. Like risks, for instance. Every company has them, and we've spotted 3 warning signs for Singapore Telecommunications (of which 1 makes us a bit uncomfortable!) you should know about.
We will like Singapore Telecommunications better if we see some big insider buys. While we wait, check out this free list of undervalued stocks (mostly small caps) with considerable, recent, insider buying.
Please note, the market returns quoted in this article reflect the market weighted average returns of stocks that currently trade on Singaporean exchanges.
If you're looking to trade Singapore Telecommunications, open an account with the lowest-cost platform trusted by professionals, Interactive Brokers.
With clients in over 200 countries and territories, and access to 160 markets, IBKR lets you trade stocks, options, futures, forex, bonds and funds from a single integrated account.
Enjoy no hidden fees, no account minimums, and FX conversion rates as low as 0.03%, far better than what most brokers offer.
Sponsored ContentNew: Manage All Your Stock Portfolios in One Place
We've created the ultimate portfolio companion for stock investors, and it's free.
• Connect an unlimited number of Portfolios and see your total in one currency
• Be alerted to new Warning Signs or Risks via email or mobile
• Track the Fair Value of your stocks
Have feedback on this article? Concerned about the content? Get in touch with us directly. Alternatively, email editorial-team (at) simplywallst.com.
This article by Simply Wall St is general in nature. We provide commentary based on historical data and analyst forecasts only using an unbiased methodology and our articles are not intended to be financial advice. It does not constitute a recommendation to buy or sell any stock, and does not take account of your objectives, or your financial situation. We aim to bring you long-term focused analysis driven by fundamental data. Note that our analysis may not factor in the latest price-sensitive company announcements or qualitative material. Simply Wall St has no position in any stocks mentioned.
Have feedback on this article? Concerned about the content? Get in touch with us directly. Alternatively, email editorial-team@simplywallst.com
About SGX:Z74
Singapore Telecommunications
Provides telecommunication services to consumers and small businesses in Singapore, Australia, China, and internationally.
Moderate growth potential with mediocre balance sheet.
Similar Companies
Market Insights


Community Narratives


