- Singapore
- /
- Healthcare Services
- /
- SGX:QC7
Q & M Dental Group (Singapore) (SGX:QC7) earnings and shareholder returns have been trending downwards for the last three years, but the stock soars 10% this past week


Q & M Dental Group (Singapore) Limited (SGX:QC7) shareholders should be happy to see the share price up 21% in the last month. But that doesn't change the fact that the returns over the last three years have been less than pleasing. In fact, the share price is down 35% in the last three years, falling well short of the market return.
While the last three years has been tough for Q & M Dental Group (Singapore) shareholders, this past week has shown signs of promise. So let's look at the longer term fundamentals and see if they've been the driver of the negative returns.
We've discovered 2 warning signs about Q & M Dental Group (Singapore). View them for free.While the efficient markets hypothesis continues to be taught by some, it has been proven that markets are over-reactive dynamic systems, and investors are not always rational. One imperfect but simple way to consider how the market perception of a company has shifted is to compare the change in the earnings per share (EPS) with the share price movement.
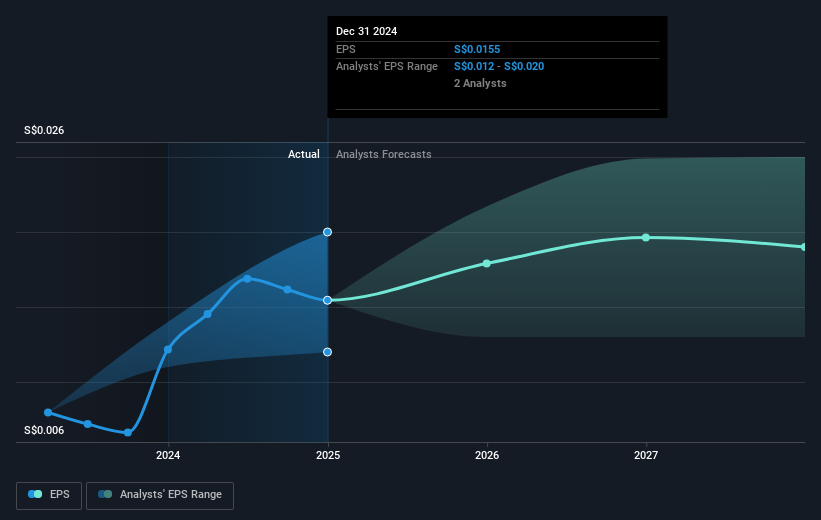
During the three years that the share price fell, Q & M Dental Group (Singapore)'s earnings per share (EPS) dropped by 22% each year. This fall in the EPS is worse than the 14% compound annual share price fall. So, despite the prior disappointment, shareholders must have some confidence the situation will improve, longer term.
The image below shows how EPS has tracked over time (if you click on the image you can see greater detail).
It's good to see that there was some significant insider buying in the last three months. That's a positive. That said, we think earnings and revenue growth trends are even more important factors to consider. Before buying or selling a stock, we always recommend a close examination of historic growth trends, available here..
What About Dividends?
It is important to consider the total shareholder return, as well as the share price return, for any given stock. Whereas the share price return only reflects the change in the share price, the TSR includes the value of dividends (assuming they were reinvested) and the benefit of any discounted capital raising or spin-off. It's fair to say that the TSR gives a more complete picture for stocks that pay a dividend. In the case of Q & M Dental Group (Singapore), it has a TSR of -29% for the last 3 years. That exceeds its share price return that we previously mentioned. And there's no prize for guessing that the dividend payments largely explain the divergence!
A Different Perspective
It's good to see that Q & M Dental Group (Singapore) has rewarded shareholders with a total shareholder return of 39% in the last twelve months. Of course, that includes the dividend. There's no doubt those recent returns are much better than the TSR loss of 0.4% per year over five years. The long term loss makes us cautious, but the short term TSR gain certainly hints at a brighter future. I find it very interesting to look at share price over the long term as a proxy for business performance. But to truly gain insight, we need to consider other information, too. For instance, we've identified 2 warning signs for Q & M Dental Group (Singapore) that you should be aware of.
If you like to buy stocks alongside management, then you might just love this free list of companies. (Hint: most of them are flying under the radar).
Please note, the market returns quoted in this article reflect the market weighted average returns of stocks that currently trade on Singaporean exchanges.
If you're looking to trade Q & M Dental Group (Singapore), open an account with the lowest-cost platform trusted by professionals, Interactive Brokers.
With clients in over 200 countries and territories, and access to 160 markets, IBKR lets you trade stocks, options, futures, forex, bonds and funds from a single integrated account.
Enjoy no hidden fees, no account minimums, and FX conversion rates as low as 0.03%, far better than what most brokers offer.
Sponsored ContentValuation is complex, but we're here to simplify it.
Discover if Q & M Dental Group (Singapore) might be undervalued or overvalued with our detailed analysis, featuring fair value estimates, potential risks, dividends, insider trades, and its financial condition.
Access Free AnalysisHave feedback on this article? Concerned about the content? Get in touch with us directly. Alternatively, email editorial-team (at) simplywallst.com.
This article by Simply Wall St is general in nature. We provide commentary based on historical data and analyst forecasts only using an unbiased methodology and our articles are not intended to be financial advice. It does not constitute a recommendation to buy or sell any stock, and does not take account of your objectives, or your financial situation. We aim to bring you long-term focused analysis driven by fundamental data. Note that our analysis may not factor in the latest price-sensitive company announcements or qualitative material. Simply Wall St has no position in any stocks mentioned.
About SGX:QC7
Q & M Dental Group (Singapore)
An investment holding company, provides private dental healthcare services in Singapore, Malaysia, China, and internationally.
Excellent balance sheet average dividend payer.
Market Insights

Community Narratives


