- Singapore
- /
- Commercial Services
- /
- SGX:BKK
Luxking Group Holdings' (SGX:BKK) Returns On Capital Not Reflecting Well On The Business


When researching a stock for investment, what can tell us that the company is in decline? Businesses in decline often have two underlying trends, firstly, a declining return on capital employed (ROCE) and a declining base of capital employed. Trends like this ultimately mean the business is reducing its investments and also earning less on what it has invested. So after we looked into Luxking Group Holdings (SGX:BKK), the trends above didn't look too great.
Return On Capital Employed (ROCE): What Is It?
If you haven't worked with ROCE before, it measures the 'return' (pre-tax profit) a company generates from capital employed in its business. The formula for this calculation on Luxking Group Holdings is:
Return on Capital Employed = Earnings Before Interest and Tax (EBIT) ÷ (Total Assets - Current Liabilities)
0.032 = CN¥4.3m ÷ (CN¥294m - CN¥159m) (Based on the trailing twelve months to June 2023).
So, Luxking Group Holdings has an ROCE of 3.2%. Ultimately, that's a low return and it under-performs the Commercial Services industry average of 6.5%.
View our latest analysis for Luxking Group Holdings
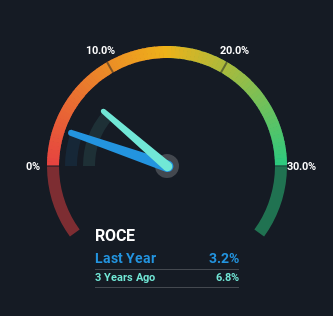
Historical performance is a great place to start when researching a stock so above you can see the gauge for Luxking Group Holdings' ROCE against it's prior returns. If you'd like to look at how Luxking Group Holdings has performed in the past in other metrics, you can view this free graph of past earnings, revenue and cash flow.
How Are Returns Trending?
The trend of ROCE at Luxking Group Holdings is showing some signs of weakness. To be more specific, today's ROCE was 6.3% five years ago but has since fallen to 3.2%. On top of that, the business is utilizing 32% less capital within its operations. When you see both ROCE and capital employed diminishing, it can often be a sign of a mature and shrinking business that might be in structural decline. Typically businesses that exhibit these characteristics aren't the ones that tend to multiply over the long term, because statistically speaking, they've already gone through the growth phase of their life cycle.
On a side note, Luxking Group Holdings' current liabilities have increased over the last five years to 54% of total assets, effectively distorting the ROCE to some degree. If current liabilities hadn't increased as much as they did, the ROCE could actually be even lower. What this means is that in reality, a rather large portion of the business is being funded by the likes of the company's suppliers or short-term creditors, which can bring some risks of its own.
The Bottom Line On Luxking Group Holdings' ROCE
In summary, it's unfortunate that Luxking Group Holdings is shrinking its capital base and also generating lower returns. Long term shareholders who've owned the stock over the last five years have experienced a 41% depreciation in their investment, so it appears the market might not like these trends either. With underlying trends that aren't great in these areas, we'd consider looking elsewhere.
One more thing, we've spotted 2 warning signs facing Luxking Group Holdings that you might find interesting.
While Luxking Group Holdings may not currently earn the highest returns, we've compiled a list of companies that currently earn more than 25% return on equity. Check out this free list here.
If you're looking to trade Luxking Group Holdings, open an account with the lowest-cost platform trusted by professionals, Interactive Brokers.
With clients in over 200 countries and territories, and access to 160 markets, IBKR lets you trade stocks, options, futures, forex, bonds and funds from a single integrated account.
Enjoy no hidden fees, no account minimums, and FX conversion rates as low as 0.03%, far better than what most brokers offer.
Sponsored ContentNew: AI Stock Screener & Alerts
Our new AI Stock Screener scans the market every day to uncover opportunities.
• Dividend Powerhouses (3%+ Yield)
• Undervalued Small Caps with Insider Buying
• High growth Tech and AI Companies
Or build your own from over 50 metrics.
Have feedback on this article? Concerned about the content? Get in touch with us directly. Alternatively, email editorial-team (at) simplywallst.com.
This article by Simply Wall St is general in nature. We provide commentary based on historical data and analyst forecasts only using an unbiased methodology and our articles are not intended to be financial advice. It does not constitute a recommendation to buy or sell any stock, and does not take account of your objectives, or your financial situation. We aim to bring you long-term focused analysis driven by fundamental data. Note that our analysis may not factor in the latest price-sensitive company announcements or qualitative material. Simply Wall St has no position in any stocks mentioned.
About SGX:BKK
Luxking Group Holdings
An investment holding company, engages in manufacturing of pressure-sensitive adhesive tape products in the People’s Republic of China, Hong Kong and internationally.
Mediocre balance sheet and slightly overvalued.
Market Insights

Community Narratives


