Does NCAB Group (STO:NCAB) Have A Healthy Balance Sheet?

Warren Buffett famously said, 'Volatility is far from synonymous with risk.' It's only natural to consider a company's balance sheet when you examine how risky it is, since debt is often involved when a business collapses. As with many other companies NCAB Group AB (publ) (STO:NCAB) makes use of debt. But is this debt a concern to shareholders?
When Is Debt Dangerous?
Generally speaking, debt only becomes a real problem when a company can't easily pay it off, either by raising capital or with its own cash flow. Part and parcel of capitalism is the process of 'creative destruction' where failed businesses are mercilessly liquidated by their bankers. However, a more usual (but still expensive) situation is where a company must dilute shareholders at a cheap share price simply to get debt under control. Of course, plenty of companies use debt to fund growth, without any negative consequences. The first thing to do when considering how much debt a business uses is to look at its cash and debt together.
How Much Debt Does NCAB Group Carry?
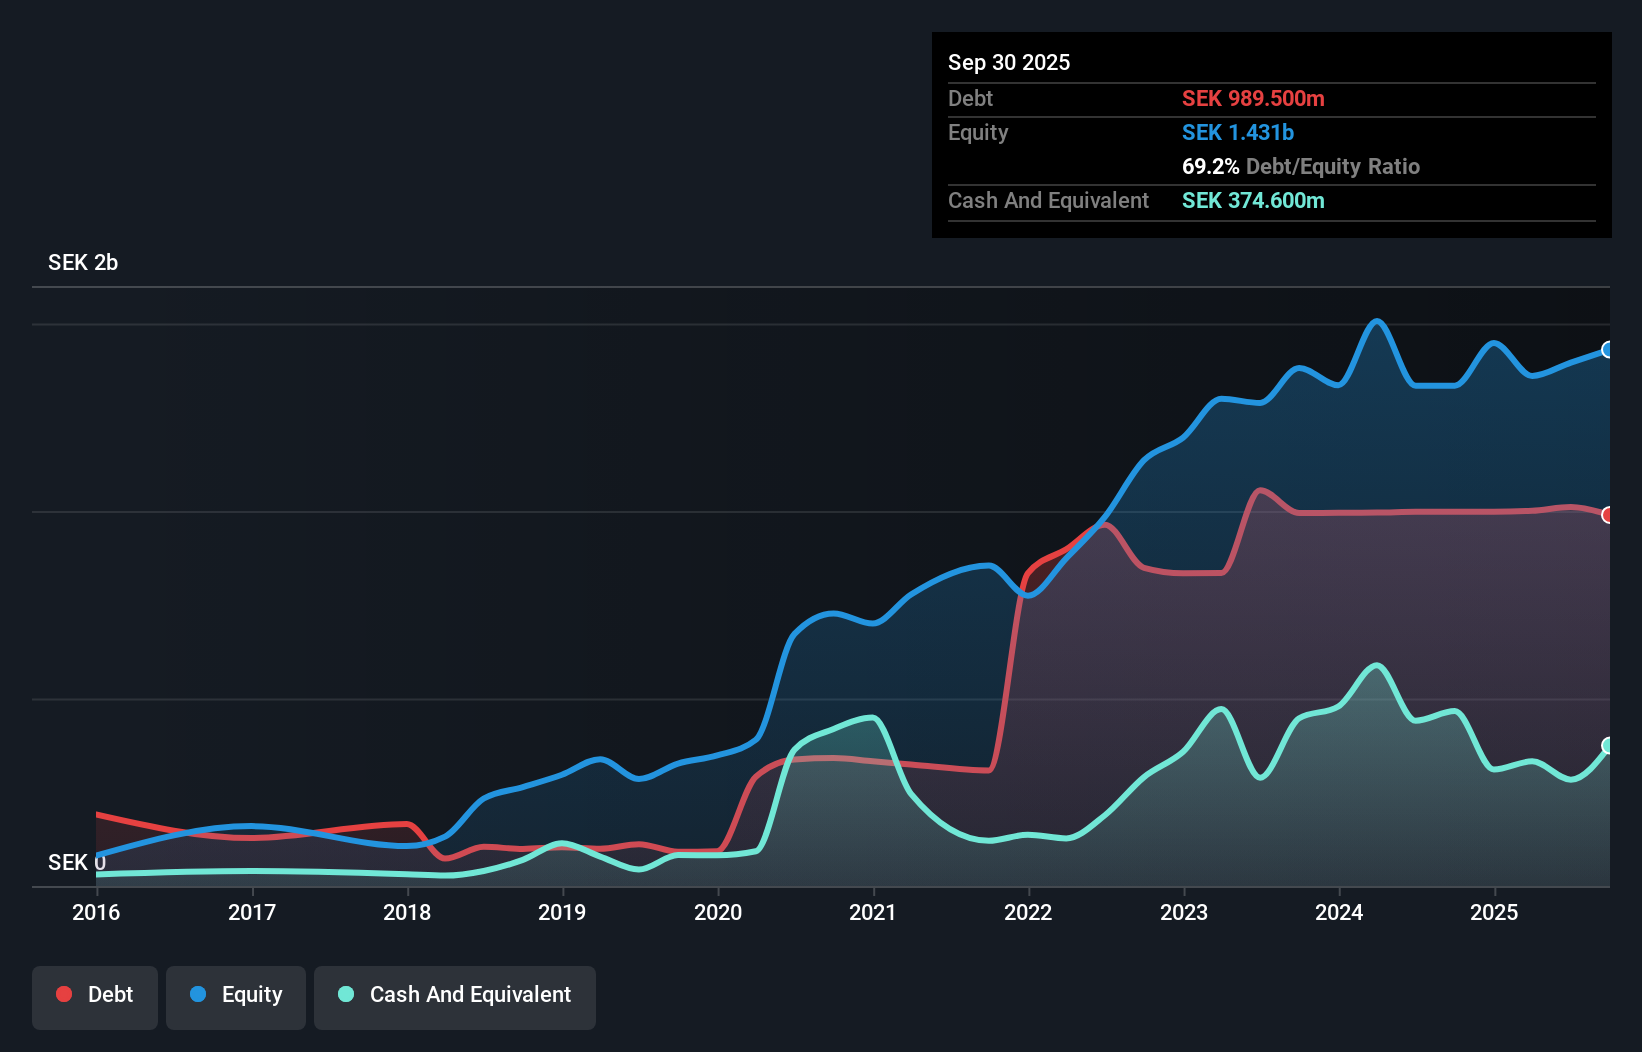
As you can see below, NCAB Group had kr989.5m of debt, at September 2025, which is about the same as the year before. You can click the chart for greater detail. On the flip side, it has kr374.6m in cash leading to net debt of about kr614.9m.
How Strong Is NCAB Group's Balance Sheet?
According to the last reported balance sheet, NCAB Group had liabilities of kr898.9m due within 12 months, and liabilities of kr1.12b due beyond 12 months. Offsetting this, it had kr374.6m in cash and kr864.3m in receivables that were due within 12 months. So its liabilities total kr775.6m more than the combination of its cash and short-term receivables.
Since publicly traded NCAB Group shares are worth a total of kr9.45b, it seems unlikely that this level of liabilities would be a major threat. Having said that, it's clear that we should continue to monitor its balance sheet, lest it change for the worse.
View our latest analysis for NCAB Group
We measure a company's debt load relative to its earnings power by looking at its net debt divided by its earnings before interest, tax, depreciation, and amortization (EBITDA) and by calculating how easily its earnings before interest and tax (EBIT) cover its interest expense (interest cover). Thus we consider debt relative to earnings both with and without depreciation and amortization expenses.
With a debt to EBITDA ratio of 1.6, NCAB Group uses debt artfully but responsibly. And the alluring interest cover (EBIT of 8.2 times interest expense) certainly does not do anything to dispel this impression. In fact NCAB Group's saving grace is its low debt levels, because its EBIT has tanked 31% in the last twelve months. When it comes to paying off debt, falling earnings are no more useful than sugary sodas are for your health. When analysing debt levels, the balance sheet is the obvious place to start. But ultimately the future profitability of the business will decide if NCAB Group can strengthen its balance sheet over time. So if you're focused on the future you can check out this free report showing analyst profit forecasts.
Finally, a company can only pay off debt with cold hard cash, not accounting profits. So we clearly need to look at whether that EBIT is leading to corresponding free cash flow. Happily for any shareholders, NCAB Group actually produced more free cash flow than EBIT over the last three years. That sort of strong cash generation warms our hearts like a puppy in a bumblebee suit.
Our View
Based on what we've seen NCAB Group is not finding it easy, given its EBIT growth rate, but the other factors we considered give us cause to be optimistic. In particular, we are dazzled with its conversion of EBIT to free cash flow. When we consider all the elements mentioned above, it seems to us that NCAB Group is managing its debt quite well. But a word of caution: we think debt levels are high enough to justify ongoing monitoring. The balance sheet is clearly the area to focus on when you are analysing debt. But ultimately, every company can contain risks that exist outside of the balance sheet. For example, we've discovered 2 warning signs for NCAB Group that you should be aware of before investing here.
At the end of the day, it's often better to focus on companies that are free from net debt. You can access our special list of such companies (all with a track record of profit growth). It's free.
The New Payments ETF Is Live on NASDAQ:
Money is moving to real-time rails, and a newly listed ETF now gives investors direct exposure. Fast settlement. Institutional custody. Simple access.
Explore how this launch could reshape portfolios
Sponsored ContentValuation is complex, but we're here to simplify it.
Discover if NCAB Group might be undervalued or overvalued with our detailed analysis, featuring fair value estimates, potential risks, dividends, insider trades, and its financial condition.
Access Free AnalysisHave feedback on this article? Concerned about the content? Get in touch with us directly. Alternatively, email editorial-team (at) simplywallst.com.
This article by Simply Wall St is general in nature. We provide commentary based on historical data and analyst forecasts only using an unbiased methodology and our articles are not intended to be financial advice. It does not constitute a recommendation to buy or sell any stock, and does not take account of your objectives, or your financial situation. We aim to bring you long-term focused analysis driven by fundamental data. Note that our analysis may not factor in the latest price-sensitive company announcements or qualitative material. Simply Wall St has no position in any stocks mentioned.
About OM:NCAB
NCAB Group
Engages in the manufacture and sale of printed circuit boards (PCBs) in Sweden, Nordic region, rest of Europe, North America, and Asia.
Reasonable growth potential with adequate balance sheet.
Market Insights

Weekly Picks

THE KINGDOM OF BROWN GOODS: WHY MGPI IS BEING CRUSHED BY INVENTORY & PRIMED FOR RESURRECTION


Why Vertical Aerospace (NYSE: EVTL) is Worth Possibly Over 13x its Current Price


The Quiet Giant That Became AI’s Power Grid
Recently Updated Narratives

Agfa-Gevaert is a digital and materials turnaround opportunity, with growth potential in ZIRFON, but carrying legacy risks.

Hitit Bilgisayar Hizmetleri will achieve a 19.7% revenue boost in the next five years


MINISO's fair value is projected at 26.69 with an anticipated PE ratio shift of 20x
Popular Narratives


MicroVision will explode future revenue by 380.37% with a vision towards success


Crazy Undervalued 42 Baggers Silver Play (Active & Running Mine)


