- Sweden
- /
- Electronic Equipment and Components
- /
- OM:HEXA B
A Look At The Fair Value Of Hexagon AB (publ) (STO:HEXA B)


Key Insights
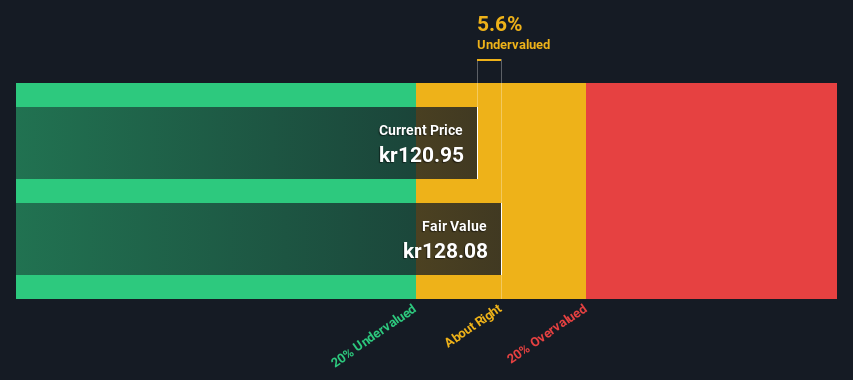
- The projected fair value for Hexagon is kr128 based on 2 Stage Free Cash Flow to Equity
- With kr121 share price, Hexagon appears to be trading close to its estimated fair value
- Our fair value estimate is 14% higher than Hexagon's analyst price target of €112
How far off is Hexagon AB (publ) (STO:HEXA B) from its intrinsic value? Using the most recent financial data, we'll take a look at whether the stock is fairly priced by projecting its future cash flows and then discounting them to today's value. We will use the Discounted Cash Flow (DCF) model on this occasion. It may sound complicated, but actually it is quite simple!
We generally believe that a company's value is the present value of all of the cash it will generate in the future. However, a DCF is just one valuation metric among many, and it is not without flaws. If you still have some burning questions about this type of valuation, take a look at the Simply Wall St analysis model.
See our latest analysis for Hexagon
The Method
We are going to use a two-stage DCF model, which, as the name states, takes into account two stages of growth. The first stage is generally a higher growth period which levels off heading towards the terminal value, captured in the second 'steady growth' period. To begin with, we have to get estimates of the next ten years of cash flows. Where possible we use analyst estimates, but when these aren't available we extrapolate the previous free cash flow (FCF) from the last estimate or reported value. We assume companies with shrinking free cash flow will slow their rate of shrinkage, and that companies with growing free cash flow will see their growth rate slow, over this period. We do this to reflect that growth tends to slow more in the early years than it does in later years.
A DCF is all about the idea that a dollar in the future is less valuable than a dollar today, so we discount the value of these future cash flows to their estimated value in today's dollars:
10-year free cash flow (FCF) estimate
| 2024 | 2025 | 2026 | 2027 | 2028 | 2029 | 2030 | 2031 | 2032 | 2033 | |
| Levered FCF (€, Millions) | €1.01b | €1.22b | €1.33b | €1.48b | €1.68b | €1.81b | €1.91b | €1.99b | €2.06b | €2.11b |
| Growth Rate Estimate Source | Analyst x9 | Analyst x8 | Analyst x4 | Analyst x3 | Analyst x2 | Est @ 7.70% | Est @ 5.62% | Est @ 4.17% | Est @ 3.15% | Est @ 2.44% |
| Present Value (€, Millions) Discounted @ 6.6% | €946 | €1.1k | €1.1k | €1.1k | €1.2k | €1.2k | €1.2k | €1.2k | €1.2k | €1.1k |
("Est" = FCF growth rate estimated by Simply Wall St)
Present Value of 10-year Cash Flow (PVCF) = €11b
After calculating the present value of future cash flows in the initial 10-year period, we need to calculate the Terminal Value, which accounts for all future cash flows beyond the first stage. The Gordon Growth formula is used to calculate Terminal Value at a future annual growth rate equal to the 5-year average of the 10-year government bond yield of 0.8%. We discount the terminal cash flows to today's value at a cost of equity of 6.6%.
Terminal Value (TV)= FCF2033 × (1 + g) ÷ (r – g) = €2.1b× (1 + 0.8%) ÷ (6.6%– 0.8%) = €37b
Present Value of Terminal Value (PVTV)= TV / (1 + r)10= €37b÷ ( 1 + 6.6%)10= €19b
The total value, or equity value, is then the sum of the present value of the future cash flows, which in this case is €31b. The last step is to then divide the equity value by the number of shares outstanding. Compared to the current share price of kr121, the company appears about fair value at a 5.6% discount to where the stock price trades currently. Remember though, that this is just an approximate valuation, and like any complex formula - garbage in, garbage out.
Important Assumptions
Now the most important inputs to a discounted cash flow are the discount rate, and of course, the actual cash flows. You don't have to agree with these inputs, I recommend redoing the calculations yourself and playing with them. The DCF also does not consider the possible cyclicality of an industry, or a company's future capital requirements, so it does not give a full picture of a company's potential performance. Given that we are looking at Hexagon as potential shareholders, the cost of equity is used as the discount rate, rather than the cost of capital (or weighted average cost of capital, WACC) which accounts for debt. In this calculation we've used 6.6%, which is based on a levered beta of 1.157. Beta is a measure of a stock's volatility, compared to the market as a whole. We get our beta from the industry average beta of globally comparable companies, with an imposed limit between 0.8 and 2.0, which is a reasonable range for a stable business.
SWOT Analysis for Hexagon
- Debt is not viewed as a risk.
- Dividends are covered by earnings and cash flows.
- Earnings growth over the past year underperformed the Electronic industry.
- Dividend is low compared to the top 25% of dividend payers in the Electronic market.
- Annual revenue is forecast to grow faster than the Swedish market.
- Current share price is below our estimate of fair value.
- Annual earnings are forecast to grow slower than the Swedish market.
Next Steps:
Whilst important, the DCF calculation is only one of many factors that you need to assess for a company. It's not possible to obtain a foolproof valuation with a DCF model. Rather it should be seen as a guide to "what assumptions need to be true for this stock to be under/overvalued?" If a company grows at a different rate, or if its cost of equity or risk free rate changes sharply, the output can look very different. For Hexagon, we've put together three relevant factors you should further research:
- Risks: For instance, we've identified 1 warning sign for Hexagon that you should be aware of.
- Management:Have insiders been ramping up their shares to take advantage of the market's sentiment for HEXA B's future outlook? Check out our management and board analysis with insights on CEO compensation and governance factors.
- Other Solid Businesses: Low debt, high returns on equity and good past performance are fundamental to a strong business. Why not explore our interactive list of stocks with solid business fundamentals to see if there are other companies you may not have considered!
PS. The Simply Wall St app conducts a discounted cash flow valuation for every stock on the OM every day. If you want to find the calculation for other stocks just search here.
Valuation is complex, but we're here to simplify it.
Discover if Hexagon might be undervalued or overvalued with our detailed analysis, featuring fair value estimates, potential risks, dividends, insider trades, and its financial condition.
Access Free AnalysisHave feedback on this article? Concerned about the content? Get in touch with us directly. Alternatively, email editorial-team (at) simplywallst.com.
This article by Simply Wall St is general in nature. We provide commentary based on historical data and analyst forecasts only using an unbiased methodology and our articles are not intended to be financial advice. It does not constitute a recommendation to buy or sell any stock, and does not take account of your objectives, or your financial situation. We aim to bring you long-term focused analysis driven by fundamental data. Note that our analysis may not factor in the latest price-sensitive company announcements or qualitative material. Simply Wall St has no position in any stocks mentioned.
About OM:HEXA B
Hexagon
Provides geospatial and industrial enterprise solutions worldwide.
Solid track record, good value and pays a dividend.

