
Advertisement
Investing in Fortnox (STO:FNOX) five years ago would have delivered you a 270% gain

While Fortnox AB (publ) (STO:FNOX) shareholders are probably generally happy, the stock hasn't had particularly good run recently, with the share price falling 11% in the last quarter. But in stark contrast, the returns over the last half decade have impressed. We think most investors would be happy with the 266% return, over that period. To some, the recent pullback wouldn't be surprising after such a fast rise. The more important question is whether the stock is too cheap or too expensive today.
Let's take a look at the underlying fundamentals over the longer term, and see if they've been consistent with shareholders returns.
See our latest analysis for Fortnox
While the efficient markets hypothesis continues to be taught by some, it has been proven that markets are over-reactive dynamic systems, and investors are not always rational. By comparing earnings per share (EPS) and share price changes over time, we can get a feel for how investor attitudes to a company have morphed over time.
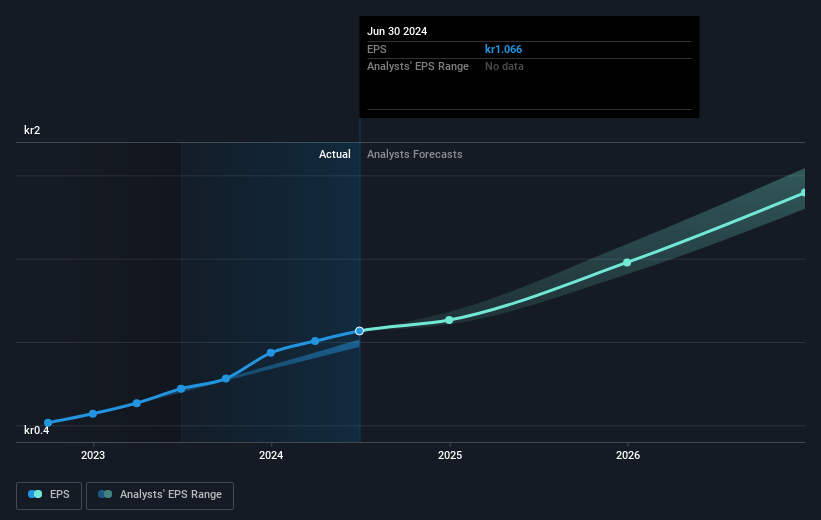
Over half a decade, Fortnox managed to grow its earnings per share at 44% a year. The EPS growth is more impressive than the yearly share price gain of 30% over the same period. So one could conclude that the broader market has become more cautious towards the stock. Having said that, the market is still optimistic, given the P/E ratio of 55.59.
You can see how EPS has changed over time in the image below (click on the chart to see the exact values).
It's probably worth noting we've seen significant insider buying in the last quarter, which we consider a positive. That said, we think earnings and revenue growth trends are even more important factors to consider. Dive deeper into the earnings by checking this interactive graph of Fortnox's earnings, revenue and cash flow.
What About Dividends?
When looking at investment returns, it is important to consider the difference between total shareholder return (TSR) and share price return. The TSR is a return calculation that accounts for the value of cash dividends (assuming that any dividend received was reinvested) and the calculated value of any discounted capital raisings and spin-offs. Arguably, the TSR gives a more comprehensive picture of the return generated by a stock. In the case of Fortnox, it has a TSR of 270% for the last 5 years. That exceeds its share price return that we previously mentioned. This is largely a result of its dividend payments!
A Different Perspective
Fortnox shareholders are up 21% for the year (even including dividends). Unfortunately this falls short of the market return. On the bright side, the longer term returns (running at about 30% a year, over half a decade) look better. Maybe the share price is just taking a breather while the business executes on its growth strategy. If you want to research this stock further, the data on insider buying is an obvious place to start. You can click here to see who has been buying shares - and the price they paid.
There are plenty of other companies that have insiders buying up shares. You probably do not want to miss this free list of undervalued small cap companies that insiders are buying.
Please note, the market returns quoted in this article reflect the market weighted average returns of stocks that currently trade on Swedish exchanges.
New: AI Stock Screener & Alerts
Our new AI Stock Screener scans the market every day to uncover opportunities.
• Dividend Powerhouses (3%+ Yield)
• Undervalued Small Caps with Insider Buying
• High growth Tech and AI Companies
Or build your own from over 50 metrics.
Have feedback on this article? Concerned about the content? Get in touch with us directly. Alternatively, email editorial-team (at) simplywallst.com.
This article by Simply Wall St is general in nature. We provide commentary based on historical data and analyst forecasts only using an unbiased methodology and our articles are not intended to be financial advice. It does not constitute a recommendation to buy or sell any stock, and does not take account of your objectives, or your financial situation. We aim to bring you long-term focused analysis driven by fundamental data. Note that our analysis may not factor in the latest price-sensitive company announcements or qualitative material. Simply Wall St has no position in any stocks mentioned.
About OM:FNOX
Fortnox
Provides smart technical products, packages, services, and integrations for financial and administration applications in small and medium sized businesses, accounting firms, and organizations in Sweden.
Flawless balance sheet with high growth potential.
Similar Companies
Market Insights


Advertisement
Community Narratives
Suncorp’s Next Chapter: Insurance-Only and Ready to Grow
Fair Value AU$22.83|5.7% undervalued
RO
Community Contributor
Thyssenkrupp Nucera Will Achieve Double-Digit Profits by 2030 Boosted by Hydrogen Growth
Fair Value €14.40|32.5% undervalued
CH
Community Contributor
Tesla’s Nvidia Moment – The AI & Robotics Inflection Point
Fair Value US$384.84|21.9% undervalued
BL
Community Contributor