
Advertisement
There are a few key trends to look for if we want to identify the next multi-bagger. Firstly, we'll want to see a proven return on capital employed (ROCE) that is increasing, and secondly, an expanding base of capital employed. If you see this, it typically means it's a company with a great business model and plenty of profitable reinvestment opportunities. So on that note, Nelly Group (STO:NELLY) looks quite promising in regards to its trends of return on capital.
What Is Return On Capital Employed (ROCE)?
If you haven't worked with ROCE before, it measures the 'return' (pre-tax profit) a company generates from capital employed in its business. Analysts use this formula to calculate it for Nelly Group:
Return on Capital Employed = Earnings Before Interest and Tax (EBIT) ÷ (Total Assets - Current Liabilities)
0.18 = kr84m ÷ (kr836m - kr374m) (Based on the trailing twelve months to September 2024).
Thus, Nelly Group has an ROCE of 18%. On its own, that's a standard return, however it's much better than the 7.9% generated by the Specialty Retail industry.
See our latest analysis for Nelly Group
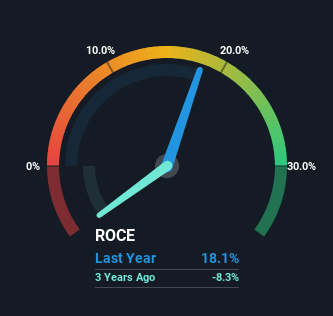
Historical performance is a great place to start when researching a stock so above you can see the gauge for Nelly Group's ROCE against it's prior returns. If you're interested in investigating Nelly Group's past further, check out this free graph covering Nelly Group's past earnings, revenue and cash flow.
What The Trend Of ROCE Can Tell Us
Like most people, we're pleased that Nelly Group is now generating some pretax earnings. While the business is profitable now, it used to be incurring losses on invested capital five years ago. In regards to capital employed, Nelly Group is using 66% less capital than it was five years ago, which on the surface, can indicate that the business has become more efficient at generating these returns. This could potentially mean that the company is selling some of its assets.
In another part of our analysis, we noticed that the company's ratio of current liabilities to total assets decreased to 45%, which broadly means the business is relying less on its suppliers or short-term creditors to fund its operations. So shareholders would be pleased that the growth in returns has mostly come from underlying business performance. However, current liabilities are still at a pretty high level, so just be aware that this can bring with it some risks.
Our Take On Nelly Group's ROCE
In the end, Nelly Group has proven it's capital allocation skills are good with those higher returns from less amount of capital. And with a respectable 90% awarded to those who held the stock over the last five years, you could argue that these developments are starting to get the attention they deserve. With that being said, we still think the promising fundamentals mean the company deserves some further due diligence.
One more thing, we've spotted 1 warning sign facing Nelly Group that you might find interesting.
While Nelly Group isn't earning the highest return, check out this free list of companies that are earning high returns on equity with solid balance sheets.
Valuation is complex, but we're here to simplify it.
Discover if Nelly Group might be undervalued or overvalued with our detailed analysis, featuring fair value estimates, potential risks, dividends, insider trades, and its financial condition.
Access Free AnalysisHave feedback on this article? Concerned about the content? Get in touch with us directly. Alternatively, email editorial-team (at) simplywallst.com.
This article by Simply Wall St is general in nature. We provide commentary based on historical data and analyst forecasts only using an unbiased methodology and our articles are not intended to be financial advice. It does not constitute a recommendation to buy or sell any stock, and does not take account of your objectives, or your financial situation. We aim to bring you long-term focused analysis driven by fundamental data. Note that our analysis may not factor in the latest price-sensitive company announcements or qualitative material. Simply Wall St has no position in any stocks mentioned.
About OM:NELLY
Nelly Group
Operates as a fashion company in Sweden, rest of Nordics, and internationally.
Outstanding track record with flawless balance sheet.
Market Insights

Advertisement
Community Narratives
A formidable player in AI and enterprise computing.
Fair Value US$210.00|10.9% overvalued
CO
Community Contributor
IREN's Bold Moves in Sustainable Bitcoin Mining & AI Data Centers
Fair Value US$72.52|12.0% undervalued
BL
Community Contributor
Cooling the Champions: The Aussie Tech Behind F1's Victories
Fair Value AU$12.40|38.7% undervalued
TR
Community Contributor