
Advertisement
Companies Like CDON (STO:CDON) Can Afford To Invest In Growth

We can readily understand why investors are attracted to unprofitable companies. For example, although Amazon.com made losses for many years after listing, if you had bought and held the shares since 1999, you would have made a fortune. Nonetheless, only a fool would ignore the risk that a loss making company burns through its cash too quickly.
So should CDON (STO:CDON) shareholders be worried about its cash burn? In this report, we will consider the company's annual negative free cash flow, henceforth referring to it as the 'cash burn'. The first step is to compare its cash burn with its cash reserves, to give us its 'cash runway'.
See our latest analysis for CDON
How Long Is CDON's Cash Runway?
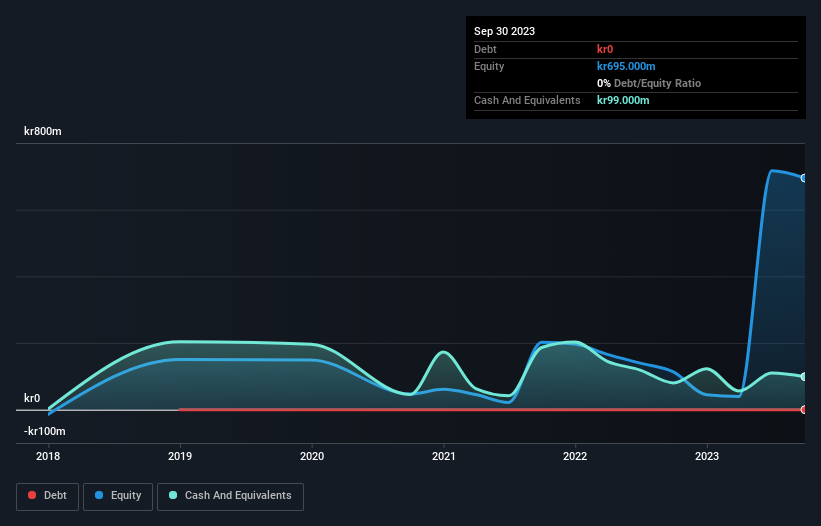
A company's cash runway is the amount of time it would take to burn through its cash reserves at its current cash burn rate. As at September 2023, CDON had cash of kr99m and no debt. In the last year, its cash burn was kr25m. That means it had a cash runway of about 3.9 years as of September 2023. There's no doubt that this is a reassuringly long runway. You can see how its cash balance has changed over time in the image below.
How Well Is CDON Growing?
CDON managed to reduce its cash burn by 76% over the last twelve months, which suggests it's on the right flight path. But it was a bit disconcerting to see operating revenue down 5.8% in that time. It seems to be growing nicely. In reality, this article only makes a short study of the company's growth data. You can take a look at how CDON has developed its business over time by checking this visualization of its revenue and earnings history.
Can CDON Raise More Cash Easily?
We are certainly impressed with the progress CDON has made over the last year, but it is also worth considering how costly it would be if it wanted to raise more cash to fund faster growth. Companies can raise capital through either debt or equity. One of the main advantages held by publicly listed companies is that they can sell shares to investors to raise cash and fund growth. We can compare a company's cash burn to its market capitalisation to get a sense for how many new shares a company would have to issue to fund one year's operations.
Since it has a market capitalisation of kr1.7b, CDON's kr25m in cash burn equates to about 1.5% of its market value. So it could almost certainly just borrow a little to fund another year's growth, or else easily raise the cash by issuing a few shares.
How Risky Is CDON's Cash Burn Situation?
As you can probably tell by now, we're not too worried about CDON's cash burn. For example, we think its cash runway suggests that the company is on a good path. Although its falling revenue does give us reason for pause, the other metrics we discussed in this article form a positive picture overall. After taking into account the various metrics mentioned in this report, we're pretty comfortable with how the company is spending its cash, as it seems on track to meet its needs over the medium term. An in-depth examination of risks revealed 2 warning signs for CDON that readers should think about before committing capital to this stock.
Of course, you might find a fantastic investment by looking elsewhere. So take a peek at this free list of companies insiders are buying, and this list of stocks growth stocks (according to analyst forecasts)
New: AI Stock Screener & Alerts
Our new AI Stock Screener scans the market every day to uncover opportunities.
• Dividend Powerhouses (3%+ Yield)
• Undervalued Small Caps with Insider Buying
• High growth Tech and AI Companies
Or build your own from over 50 metrics.
Have feedback on this article? Concerned about the content? Get in touch with us directly. Alternatively, email editorial-team (at) simplywallst.com.
This article by Simply Wall St is general in nature. We provide commentary based on historical data and analyst forecasts only using an unbiased methodology and our articles are not intended to be financial advice. It does not constitute a recommendation to buy or sell any stock, and does not take account of your objectives, or your financial situation. We aim to bring you long-term focused analysis driven by fundamental data. Note that our analysis may not factor in the latest price-sensitive company announcements or qualitative material. Simply Wall St has no position in any stocks mentioned.
About OM:CDON
Adequate balance sheet low.
Similar Companies
Market Insights

Advertisement
Community Narratives
Groundbreaking therapies that could change the treatment landscape for PTSD, fibromyalgia, MS & Alzheimer’s
Fair Value US$6.20|86.9% undervalued
CM
Community Contributor
DigitalOcean Will Grow 14% by Embracing AI with Paperspace Acquisition
Fair Value US$50.00|41.7% undervalued
NE
Community Contributor
Viant Technology: A Rising AdTech Challenger in the AI-Powered CTV Market
Fair Value US$38.61|63.2% undervalued
BL
Community Contributor
Volvo will Accelerate Forward into Electric and Autonomous Leadership in Five Years
Fair Value SEK 438.80|39.7% undervalued
UN
Community Contributor