
Advertisement

The external fund manager backed by Berkshire Hathaway's Charlie Munger, Li Lu, makes no bones about it when he says 'The biggest investment risk is not the volatility of prices, but whether you will suffer a permanent loss of capital.' So it seems the smart money knows that debt - which is usually involved in bankruptcies - is a very important factor, when you assess how risky a company is. As with many other companies Teqnion AB (publ) (STO:TEQ) makes use of debt. But the real question is whether this debt is making the company risky.
Why Does Debt Bring Risk?
Generally speaking, debt only becomes a real problem when a company can't easily pay it off, either by raising capital or with its own cash flow. In the worst case scenario, a company can go bankrupt if it cannot pay its creditors. However, a more usual (but still expensive) situation is where a company must dilute shareholders at a cheap share price simply to get debt under control. Of course, plenty of companies use debt to fund growth, without any negative consequences. The first thing to do when considering how much debt a business uses is to look at its cash and debt together.
Check out our latest analysis for Teqnion
How Much Debt Does Teqnion Carry?
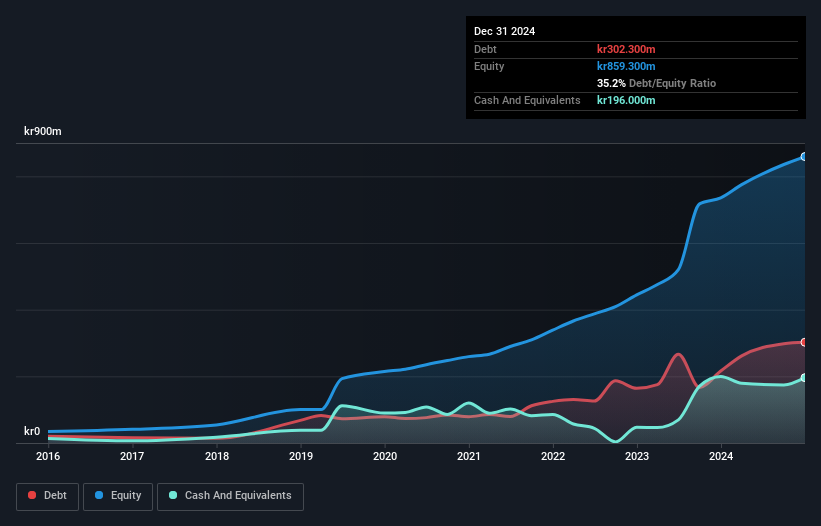
You can click the graphic below for the historical numbers, but it shows that as of December 2024 Teqnion had kr302.3m of debt, an increase on kr215.8m, over one year. However, because it has a cash reserve of kr196.0m, its net debt is less, at about kr106.3m.
A Look At Teqnion's Liabilities
We can see from the most recent balance sheet that Teqnion had liabilities of kr374.8m falling due within a year, and liabilities of kr487.7m due beyond that. Offsetting these obligations, it had cash of kr196.0m as well as receivables valued at kr276.6m due within 12 months. So its liabilities total kr389.9m more than the combination of its cash and short-term receivables.
Given Teqnion has a market capitalization of kr2.75b, it's hard to believe these liabilities pose much threat. Having said that, it's clear that we should continue to monitor its balance sheet, lest it change for the worse.
We use two main ratios to inform us about debt levels relative to earnings. The first is net debt divided by earnings before interest, tax, depreciation, and amortization (EBITDA), while the second is how many times its earnings before interest and tax (EBIT) covers its interest expense (or its interest cover, for short). The advantage of this approach is that we take into account both the absolute quantum of debt (with net debt to EBITDA) and the actual interest expenses associated with that debt (with its interest cover ratio).
While Teqnion's low debt to EBITDA ratio of 0.50 suggests only modest use of debt, the fact that EBIT only covered the interest expense by 5.1 times last year does give us pause. But the interest payments are certainly sufficient to have us thinking about how affordable its debt is. Unfortunately, Teqnion saw its EBIT slide 6.2% in the last twelve months. If earnings continue on that decline then managing that debt will be difficult like delivering hot soup on a unicycle. There's no doubt that we learn most about debt from the balance sheet. But it is Teqnion's earnings that will influence how the balance sheet holds up in the future. So when considering debt, it's definitely worth looking at the earnings trend. Click here for an interactive snapshot.
But our final consideration is also important, because a company cannot pay debt with paper profits; it needs cold hard cash. So we always check how much of that EBIT is translated into free cash flow. During the last three years, Teqnion produced sturdy free cash flow equating to 67% of its EBIT, about what we'd expect. This cold hard cash means it can reduce its debt when it wants to.
Our View
Teqnion's net debt to EBITDA suggests it can handle its debt as easily as Cristiano Ronaldo could score a goal against an under 14's goalkeeper. But, on a more sombre note, we are a little concerned by its EBIT growth rate. All these things considered, it appears that Teqnion can comfortably handle its current debt levels. Of course, while this leverage can enhance returns on equity, it does bring more risk, so it's worth keeping an eye on this one. Above most other metrics, we think its important to track how fast earnings per share is growing, if at all. If you've also come to that realization, you're in luck, because today you can view this interactive graph of Teqnion's earnings per share history for free.
At the end of the day, it's often better to focus on companies that are free from net debt. You can access our special list of such companies (all with a track record of profit growth). It's free.
Valuation is complex, but we're here to simplify it.
Discover if Teqnion might be undervalued or overvalued with our detailed analysis, featuring fair value estimates, potential risks, dividends, insider trades, and its financial condition.
Access Free AnalysisHave feedback on this article? Concerned about the content? Get in touch with us directly. Alternatively, email editorial-team (at) simplywallst.com.
This article by Simply Wall St is general in nature. We provide commentary based on historical data and analyst forecasts only using an unbiased methodology and our articles are not intended to be financial advice. It does not constitute a recommendation to buy or sell any stock, and does not take account of your objectives, or your financial situation. We aim to bring you long-term focused analysis driven by fundamental data. Note that our analysis may not factor in the latest price-sensitive company announcements or qualitative material. Simply Wall St has no position in any stocks mentioned.
About OM:TEQ
Teqnion
A diversified industrial company, provides a range of products in selected niche markets.
Excellent balance sheet and slightly overvalued.
Market Insights

Advertisement
Community Narratives
Pinterest will surge as advertising innovations ignite revenue growth
Fair Value US$42.63|26.1% undervalued
BR
Community Contributor
Brambles' Revenue Set to Climb 14% with Profit Margins Following
Fair Value AU$21.90|4.8% overvalued
RO
Community Contributor
Challenging Future for STG as Organic Sales Decline by 8.8%
Fair Value DKK 116.13|26.8% undervalued
KA
Community Contributor