

Warren Buffett famously said, 'Volatility is far from synonymous with risk.' It's only natural to consider a company's balance sheet when you examine how risky it is, since debt is often involved when a business collapses. We note that OXE Marine AB (publ) (STO:OXE) does have debt on its balance sheet. But the more important question is: how much risk is that debt creating?
Why Does Debt Bring Risk?
Generally speaking, debt only becomes a real problem when a company can't easily pay it off, either by raising capital or with its own cash flow. Part and parcel of capitalism is the process of 'creative destruction' where failed businesses are mercilessly liquidated by their bankers. However, a more common (but still painful) scenario is that it has to raise new equity capital at a low price, thus permanently diluting shareholders. By replacing dilution, though, debt can be an extremely good tool for businesses that need capital to invest in growth at high rates of return. When we examine debt levels, we first consider both cash and debt levels, together.
See our latest analysis for OXE Marine
How Much Debt Does OXE Marine Carry?
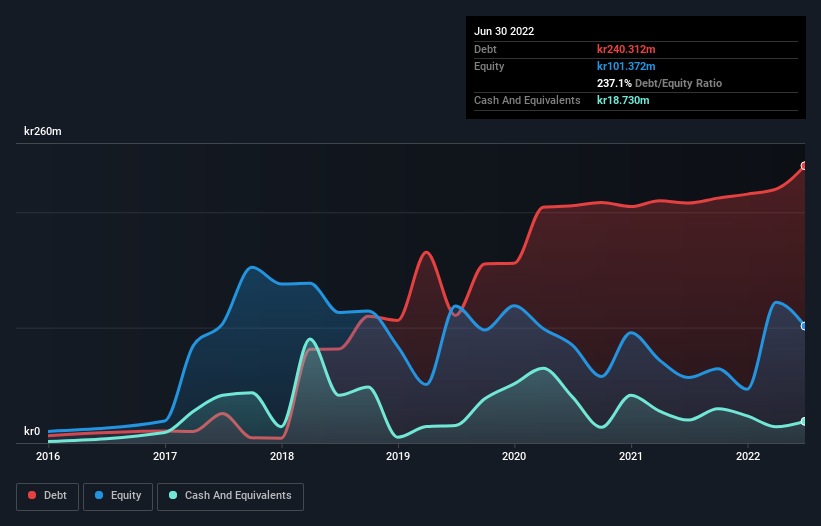
The image below, which you can click on for greater detail, shows that at June 2022 OXE Marine had debt of kr240.3m, up from kr208.0m in one year. However, it also had kr18.7m in cash, and so its net debt is kr221.6m.
A Look At OXE Marine's Liabilities
We can see from the most recent balance sheet that OXE Marine had liabilities of kr77.2m falling due within a year, and liabilities of kr225.8m due beyond that. Offsetting these obligations, it had cash of kr18.7m as well as receivables valued at kr25.0m due within 12 months. So it has liabilities totalling kr259.3m more than its cash and near-term receivables, combined.
This is a mountain of leverage relative to its market capitalization of kr413.0m. This suggests shareholders would be heavily diluted if the company needed to shore up its balance sheet in a hurry. When analysing debt levels, the balance sheet is the obvious place to start. But it is future earnings, more than anything, that will determine OXE Marine's ability to maintain a healthy balance sheet going forward. So if you're focused on the future you can check out this free report showing analyst profit forecasts.
Over 12 months, OXE Marine reported revenue of kr157m, which is a gain of 109%, although it did not report any earnings before interest and tax. So there's no doubt that shareholders are cheering for growth
Caveat Emptor
While we can certainly appreciate OXE Marine's revenue growth, its earnings before interest and tax (EBIT) loss is not ideal. Its EBIT loss was a whopping kr67m. Considering that alongside the liabilities mentioned above does not give us much confidence that company should be using so much debt. So we think its balance sheet is a little strained, though not beyond repair. For example, we would not want to see a repeat of last year's loss of kr77m. So we do think this stock is quite risky. When analysing debt levels, the balance sheet is the obvious place to start. However, not all investment risk resides within the balance sheet - far from it. To that end, you should be aware of the 3 warning signs we've spotted with OXE Marine .
When all is said and done, sometimes its easier to focus on companies that don't even need debt. Readers can access a list of growth stocks with zero net debt 100% free, right now.
If you're looking to trade OXE Marine, open an account with the lowest-cost platform trusted by professionals, Interactive Brokers.
With clients in over 200 countries and territories, and access to 160 markets, IBKR lets you trade stocks, options, futures, forex, bonds and funds from a single integrated account.
Enjoy no hidden fees, no account minimums, and FX conversion rates as low as 0.03%, far better than what most brokers offer.
Sponsored ContentNew: AI Stock Screener & Alerts
Our new AI Stock Screener scans the market every day to uncover opportunities.
• Dividend Powerhouses (3%+ Yield)
• Undervalued Small Caps with Insider Buying
• High growth Tech and AI Companies
Or build your own from over 50 metrics.
Have feedback on this article? Concerned about the content? Get in touch with us directly. Alternatively, email editorial-team (at) simplywallst.com.
This article by Simply Wall St is general in nature. We provide commentary based on historical data and analyst forecasts only using an unbiased methodology and our articles are not intended to be financial advice. It does not constitute a recommendation to buy or sell any stock, and does not take account of your objectives, or your financial situation. We aim to bring you long-term focused analysis driven by fundamental data. Note that our analysis may not factor in the latest price-sensitive company announcements or qualitative material. Simply Wall St has no position in any stocks mentioned.
About OM:OXE
OXE Marine
Designs, develops, and distributes diesel outboard engines for the marine market in Sweden and internationally.
Moderate with adequate balance sheet.
Market Insights

Community Narratives


