Health Check: How Prudently Does OXE Marine (STO:OXE) Use Debt?


Warren Buffett famously said, 'Volatility is far from synonymous with risk.' So it seems the smart money knows that debt - which is usually involved in bankruptcies - is a very important factor, when you assess how risky a company is. We note that OXE Marine AB (publ) (STO:OXE) does have debt on its balance sheet. But is this debt a concern to shareholders?
When Is Debt A Problem?
Debt is a tool to help businesses grow, but if a business is incapable of paying off its lenders, then it exists at their mercy. Ultimately, if the company can't fulfill its legal obligations to repay debt, shareholders could walk away with nothing. While that is not too common, we often do see indebted companies permanently diluting shareholders because lenders force them to raise capital at a distressed price. Of course, debt can be an important tool in businesses, particularly capital heavy businesses. When we examine debt levels, we first consider both cash and debt levels, together.
See our latest analysis for OXE Marine
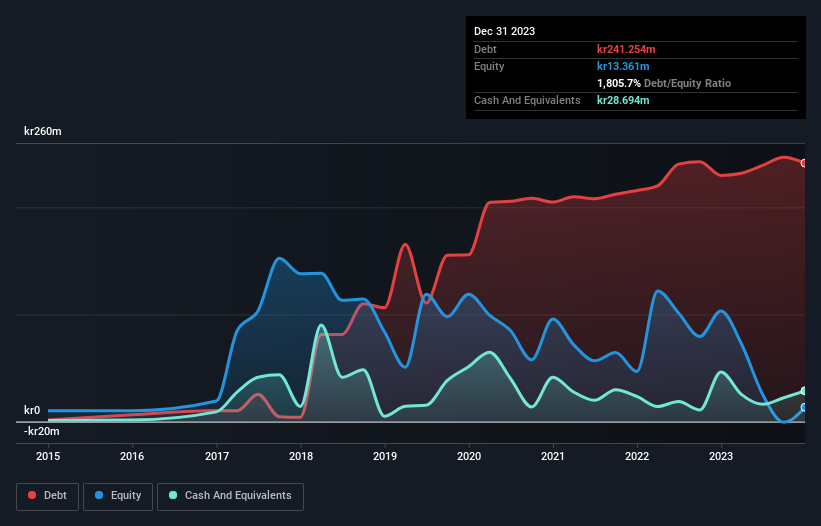
What Is OXE Marine's Debt?
The image below, which you can click on for greater detail, shows that at December 2023 OXE Marine had debt of kr241.3m, up from kr229.8m in one year. However, it does have kr28.7m in cash offsetting this, leading to net debt of about kr212.6m.
How Strong Is OXE Marine's Balance Sheet?
We can see from the most recent balance sheet that OXE Marine had liabilities of kr78.3m falling due within a year, and liabilities of kr247.7m due beyond that. On the other hand, it had cash of kr28.7m and kr35.9m worth of receivables due within a year. So its liabilities total kr261.3m more than the combination of its cash and short-term receivables.
This deficit is considerable relative to its market capitalization of kr298.8m, so it does suggest shareholders should keep an eye on OXE Marine's use of debt. This suggests shareholders would be heavily diluted if the company needed to shore up its balance sheet in a hurry. When analysing debt levels, the balance sheet is the obvious place to start. But ultimately the future profitability of the business will decide if OXE Marine can strengthen its balance sheet over time. So if you're focused on the future you can check out this free report showing analyst profit forecasts.
Over 12 months, OXE Marine reported revenue of kr190m, which is a gain of 27%, although it did not report any earnings before interest and tax. Shareholders probably have their fingers crossed that it can grow its way to profits.
Caveat Emptor
Even though OXE Marine managed to grow its top line quite deftly, the cold hard truth is that it is losing money on the EBIT line. Its EBIT loss was a whopping kr108m. Considering that alongside the liabilities mentioned above does not give us much confidence that company should be using so much debt. So we think its balance sheet is a little strained, though not beyond repair. However, it doesn't help that it burned through kr52m of cash over the last year. So suffice it to say we consider the stock very risky. When analysing debt levels, the balance sheet is the obvious place to start. However, not all investment risk resides within the balance sheet - far from it. For example OXE Marine has 5 warning signs (and 1 which is potentially serious) we think you should know about.
If, after all that, you're more interested in a fast growing company with a rock-solid balance sheet, then check out our list of net cash growth stocks without delay.
If you're looking to trade OXE Marine, open an account with the lowest-cost platform trusted by professionals, Interactive Brokers.
With clients in over 200 countries and territories, and access to 160 markets, IBKR lets you trade stocks, options, futures, forex, bonds and funds from a single integrated account.
Enjoy no hidden fees, no account minimums, and FX conversion rates as low as 0.03%, far better than what most brokers offer.
Sponsored ContentNew: AI Stock Screener & Alerts
Our new AI Stock Screener scans the market every day to uncover opportunities.
• Dividend Powerhouses (3%+ Yield)
• Undervalued Small Caps with Insider Buying
• High growth Tech and AI Companies
Or build your own from over 50 metrics.
Have feedback on this article? Concerned about the content? Get in touch with us directly. Alternatively, email editorial-team (at) simplywallst.com.
This article by Simply Wall St is general in nature. We provide commentary based on historical data and analyst forecasts only using an unbiased methodology and our articles are not intended to be financial advice. It does not constitute a recommendation to buy or sell any stock, and does not take account of your objectives, or your financial situation. We aim to bring you long-term focused analysis driven by fundamental data. Note that our analysis may not factor in the latest price-sensitive company announcements or qualitative material. Simply Wall St has no position in any stocks mentioned.
About OM:OXE
OXE Marine
Designs, develops, and distributes diesel outboard engines for the marine market in Sweden and internationally.
Moderate with adequate balance sheet.
Market Insights

Community Narratives


