
Advertisement
- Sweden
- /
- Construction
- /
- OM:OX2
These 4 Measures Indicate That OX2 (STO:OX2) Is Using Debt Reasonably Well

Warren Buffett famously said, 'Volatility is far from synonymous with risk.' So it might be obvious that you need to consider debt, when you think about how risky any given stock is, because too much debt can sink a company. As with many other companies OX2 AB (publ) (STO:OX2) makes use of debt. But should shareholders be worried about its use of debt?
When Is Debt Dangerous?
Debt and other liabilities become risky for a business when it cannot easily fulfill those obligations, either with free cash flow or by raising capital at an attractive price. Ultimately, if the company can't fulfill its legal obligations to repay debt, shareholders could walk away with nothing. However, a more frequent (but still costly) occurrence is where a company must issue shares at bargain-basement prices, permanently diluting shareholders, just to shore up its balance sheet. Having said that, the most common situation is where a company manages its debt reasonably well - and to its own advantage. When we think about a company's use of debt, we first look at cash and debt together.
Check out our latest analysis for OX2
What Is OX2's Net Debt?
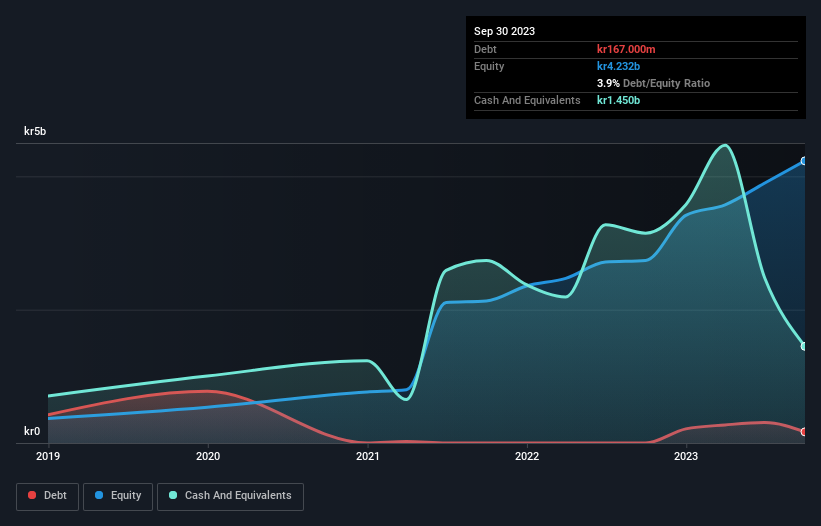
You can click the graphic below for the historical numbers, but it shows that as of September 2023 OX2 had kr167.0m of debt, an increase on none, over one year. But on the other hand it also has kr1.45b in cash, leading to a kr1.28b net cash position.
A Look At OX2's Liabilities
The latest balance sheet data shows that OX2 had liabilities of kr3.01b due within a year, and liabilities of kr146.0m falling due after that. Offsetting this, it had kr1.45b in cash and kr1.65b in receivables that were due within 12 months. So these liquid assets roughly match the total liabilities.
This state of affairs indicates that OX2's balance sheet looks quite solid, as its total liabilities are just about equal to its liquid assets. So it's very unlikely that the kr16.0b company is short on cash, but still worth keeping an eye on the balance sheet. Despite its noteworthy liabilities, OX2 boasts net cash, so it's fair to say it does not have a heavy debt load!
On top of that, OX2 grew its EBIT by 76% over the last twelve months, and that growth will make it easier to handle its debt. When analysing debt levels, the balance sheet is the obvious place to start. But it is future earnings, more than anything, that will determine OX2's ability to maintain a healthy balance sheet going forward. So if you want to see what the professionals think, you might find this free report on analyst profit forecasts to be interesting.
Finally, while the tax-man may adore accounting profits, lenders only accept cold hard cash. While OX2 has net cash on its balance sheet, it's still worth taking a look at its ability to convert earnings before interest and tax (EBIT) to free cash flow, to help us understand how quickly it is building (or eroding) that cash balance. In the last three years, OX2 created free cash flow amounting to 11% of its EBIT, an uninspiring performance. That limp level of cash conversion undermines its ability to manage and pay down debt.
Summing Up
While it is always sensible to look at a company's total liabilities, it is very reassuring that OX2 has kr1.28b in net cash. And we liked the look of last year's 76% year-on-year EBIT growth. So we don't think OX2's use of debt is risky. We'd be motivated to research the stock further if we found out that OX2 insiders have bought shares recently. If you would too, then you're in luck, since today we're sharing our list of reported insider transactions for free.
Of course, if you're the type of investor who prefers buying stocks without the burden of debt, then don't hesitate to discover our exclusive list of net cash growth stocks, today.
New: AI Stock Screener & Alerts
Our new AI Stock Screener scans the market every day to uncover opportunities.
• Dividend Powerhouses (3%+ Yield)
• Undervalued Small Caps with Insider Buying
• High growth Tech and AI Companies
Or build your own from over 50 metrics.
Have feedback on this article? Concerned about the content? Get in touch with us directly. Alternatively, email editorial-team (at) simplywallst.com.
This article by Simply Wall St is general in nature. We provide commentary based on historical data and analyst forecasts only using an unbiased methodology and our articles are not intended to be financial advice. It does not constitute a recommendation to buy or sell any stock, and does not take account of your objectives, or your financial situation. We aim to bring you long-term focused analysis driven by fundamental data. Note that our analysis may not factor in the latest price-sensitive company announcements or qualitative material. Simply Wall St has no position in any stocks mentioned.
About OM:OX2
Flawless balance sheet and slightly overvalued.
Similar Companies
Market Insights

Advertisement
Community Narratives
Scaling up in building materials with smart M&A and growing profitability
Fair Value US$2.77|31.0% undervalued
CM
Community Contributor
Hims: The Platform Powering Personalised Healthcare
Fair Value US$114.01|53.1% undervalued
BL
Community Contributor
Undervalued lottery company with strong fundamentals
Fair Value AU$15.00|34.5% undervalued
RO
Community Contributor
Proximus, transferring money from the impatient to the patient investor
Fair Value €16.62|54.5% undervalued
AX
Community Contributor