Calculating The Intrinsic Value Of Husqvarna AB (publ) (STO:HUSQ B)


Key Insights
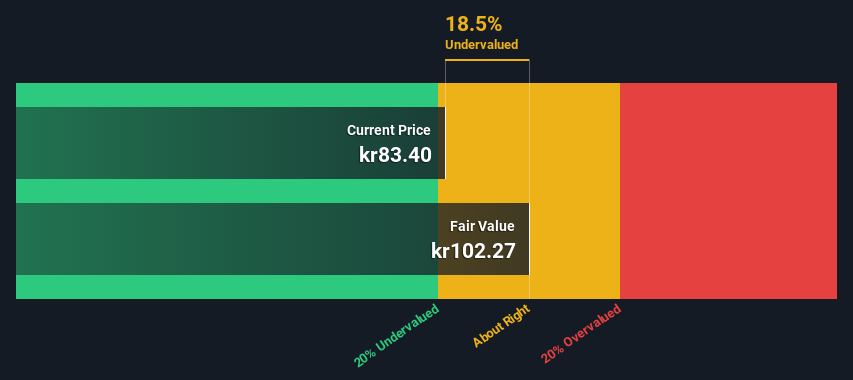
- The projected fair value for Husqvarna is kr102 based on 2 Stage Free Cash Flow to Equity
- Current share price of kr83.40 suggests Husqvarna is potentially trading close to its fair value
- The kr84.67 analyst price target for HUSQ B is 17% less than our estimate of fair value
In this article we are going to estimate the intrinsic value of Husqvarna AB (publ) (STO:HUSQ B) by estimating the company's future cash flows and discounting them to their present value. We will use the Discounted Cash Flow (DCF) model on this occasion. It may sound complicated, but actually it is quite simple!
We generally believe that a company's value is the present value of all of the cash it will generate in the future. However, a DCF is just one valuation metric among many, and it is not without flaws. Anyone interested in learning a bit more about intrinsic value should have a read of the Simply Wall St analysis model.
Check out our latest analysis for Husqvarna
What's The Estimated Valuation?
We are going to use a two-stage DCF model, which, as the name states, takes into account two stages of growth. The first stage is generally a higher growth period which levels off heading towards the terminal value, captured in the second 'steady growth' period. To begin with, we have to get estimates of the next ten years of cash flows. Where possible we use analyst estimates, but when these aren't available we extrapolate the previous free cash flow (FCF) from the last estimate or reported value. We assume companies with shrinking free cash flow will slow their rate of shrinkage, and that companies with growing free cash flow will see their growth rate slow, over this period. We do this to reflect that growth tends to slow more in the early years than it does in later years.
A DCF is all about the idea that a dollar in the future is less valuable than a dollar today, so we need to discount the sum of these future cash flows to arrive at a present value estimate:
10-year free cash flow (FCF) estimate
| 2024 | 2025 | 2026 | 2027 | 2028 | 2029 | 2030 | 2031 | 2032 | 2033 | |
| Levered FCF (SEK, Millions) | kr4.30b | kr3.82b | kr3.90b | kr3.80b | kr3.74b | kr3.70b | kr3.69b | kr3.69b | kr3.70b | kr3.71b |
| Growth Rate Estimate Source | Analyst x5 | Analyst x5 | Analyst x1 | Est @ -2.56% | Est @ -1.56% | Est @ -0.85% | Est @ -0.36% | Est @ -0.02% | Est @ 0.22% | Est @ 0.39% |
| Present Value (SEK, Millions) Discounted @ 6.9% | kr4.0k | kr3.3k | kr3.2k | kr2.9k | kr2.7k | kr2.5k | kr2.3k | kr2.2k | kr2.0k | kr1.9k |
("Est" = FCF growth rate estimated by Simply Wall St)
Present Value of 10-year Cash Flow (PVCF) = kr27b
After calculating the present value of future cash flows in the initial 10-year period, we need to calculate the Terminal Value, which accounts for all future cash flows beyond the first stage. For a number of reasons a very conservative growth rate is used that cannot exceed that of a country's GDP growth. In this case we have used the 5-year average of the 10-year government bond yield (0.8%) to estimate future growth. In the same way as with the 10-year 'growth' period, we discount future cash flows to today's value, using a cost of equity of 6.9%.
Terminal Value (TV)= FCF2033 × (1 + g) ÷ (r – g) = kr3.7b× (1 + 0.8%) ÷ (6.9%– 0.8%) = kr61b
Present Value of Terminal Value (PVTV)= TV / (1 + r)10= kr61b÷ ( 1 + 6.9%)10= kr31b
The total value, or equity value, is then the sum of the present value of the future cash flows, which in this case is kr58b. The last step is to then divide the equity value by the number of shares outstanding. Compared to the current share price of kr83.4, the company appears about fair value at a 18% discount to where the stock price trades currently. Remember though, that this is just an approximate valuation, and like any complex formula - garbage in, garbage out.
Important Assumptions
We would point out that the most important inputs to a discounted cash flow are the discount rate and of course the actual cash flows. If you don't agree with these result, have a go at the calculation yourself and play with the assumptions. The DCF also does not consider the possible cyclicality of an industry, or a company's future capital requirements, so it does not give a full picture of a company's potential performance. Given that we are looking at Husqvarna as potential shareholders, the cost of equity is used as the discount rate, rather than the cost of capital (or weighted average cost of capital, WACC) which accounts for debt. In this calculation we've used 6.9%, which is based on a levered beta of 1.223. Beta is a measure of a stock's volatility, compared to the market as a whole. We get our beta from the industry average beta of globally comparable companies, with an imposed limit between 0.8 and 2.0, which is a reasonable range for a stable business.
SWOT Analysis for Husqvarna
- Earnings growth over the past year exceeded its 5-year average.
- Debt is well covered by earnings and cashflows.
- Dividends are covered by earnings and cash flows.
- Earnings growth over the past year underperformed the Machinery industry.
- Dividend is low compared to the top 25% of dividend payers in the Machinery market.
- Annual earnings are forecast to grow faster than the Swedish market.
- Good value based on P/E ratio and estimated fair value.
- Annual revenue is forecast to grow slower than the Swedish market.
Next Steps:
Although the valuation of a company is important, it ideally won't be the sole piece of analysis you scrutinize for a company. The DCF model is not a perfect stock valuation tool. Preferably you'd apply different cases and assumptions and see how they would impact the company's valuation. For example, changes in the company's cost of equity or the risk free rate can significantly impact the valuation. For Husqvarna, there are three pertinent items you should assess:
- Risks: Take risks, for example - Husqvarna has 2 warning signs we think you should be aware of.
- Future Earnings: How does HUSQ B's growth rate compare to its peers and the wider market? Dig deeper into the analyst consensus number for the upcoming years by interacting with our free analyst growth expectation chart.
- Other High Quality Alternatives: Do you like a good all-rounder? Explore our interactive list of high quality stocks to get an idea of what else is out there you may be missing!
PS. The Simply Wall St app conducts a discounted cash flow valuation for every stock on the OM every day. If you want to find the calculation for other stocks just search here.
Valuation is complex, but we're here to simplify it.
Discover if Husqvarna might be undervalued or overvalued with our detailed analysis, featuring fair value estimates, potential risks, dividends, insider trades, and its financial condition.
Access Free AnalysisHave feedback on this article? Concerned about the content? Get in touch with us directly. Alternatively, email editorial-team (at) simplywallst.com.
This article by Simply Wall St is general in nature. We provide commentary based on historical data and analyst forecasts only using an unbiased methodology and our articles are not intended to be financial advice. It does not constitute a recommendation to buy or sell any stock, and does not take account of your objectives, or your financial situation. We aim to bring you long-term focused analysis driven by fundamental data. Note that our analysis may not factor in the latest price-sensitive company announcements or qualitative material. Simply Wall St has no position in any stocks mentioned.
About OM:HUSQ B
Husqvarna
Produces and sells outdoor power products, watering products, and lawn care power equipment.
Adequate balance sheet slight.
Similar Companies
Market Insights

Community Narratives


