Advertisement
- Sweden
- /
- Electrical
- /
- OM:FAG
European Companies Priced Below Estimated Value In May 2025

Simply Wall St
Reviewed by Simply Wall St

As European markets show mixed results with the pan-European STOXX Europe 600 Index rising for a fourth consecutive week, investors are closely watching developments in trade tensions and monetary policy shifts. In this environment, identifying undervalued stocks becomes crucial, as these companies may offer potential opportunities by being priced below their estimated value amidst ongoing economic uncertainties.
Top 10 Undervalued Stocks Based On Cash Flows In Europe
| Name | Current Price | Fair Value (Est) | Discount (Est) |
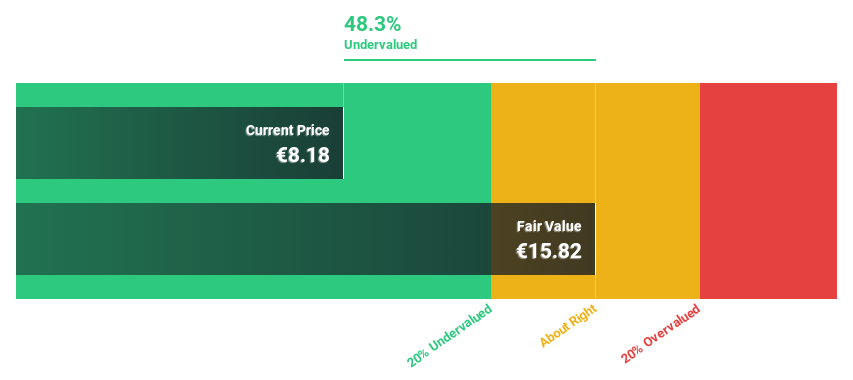
| ILPRA (BIT:ILP) | €4.54 | €8.76 | 48.2% |
| adidas (XTRA:ADS) | €223.80 | €440.87 | 49.2% |
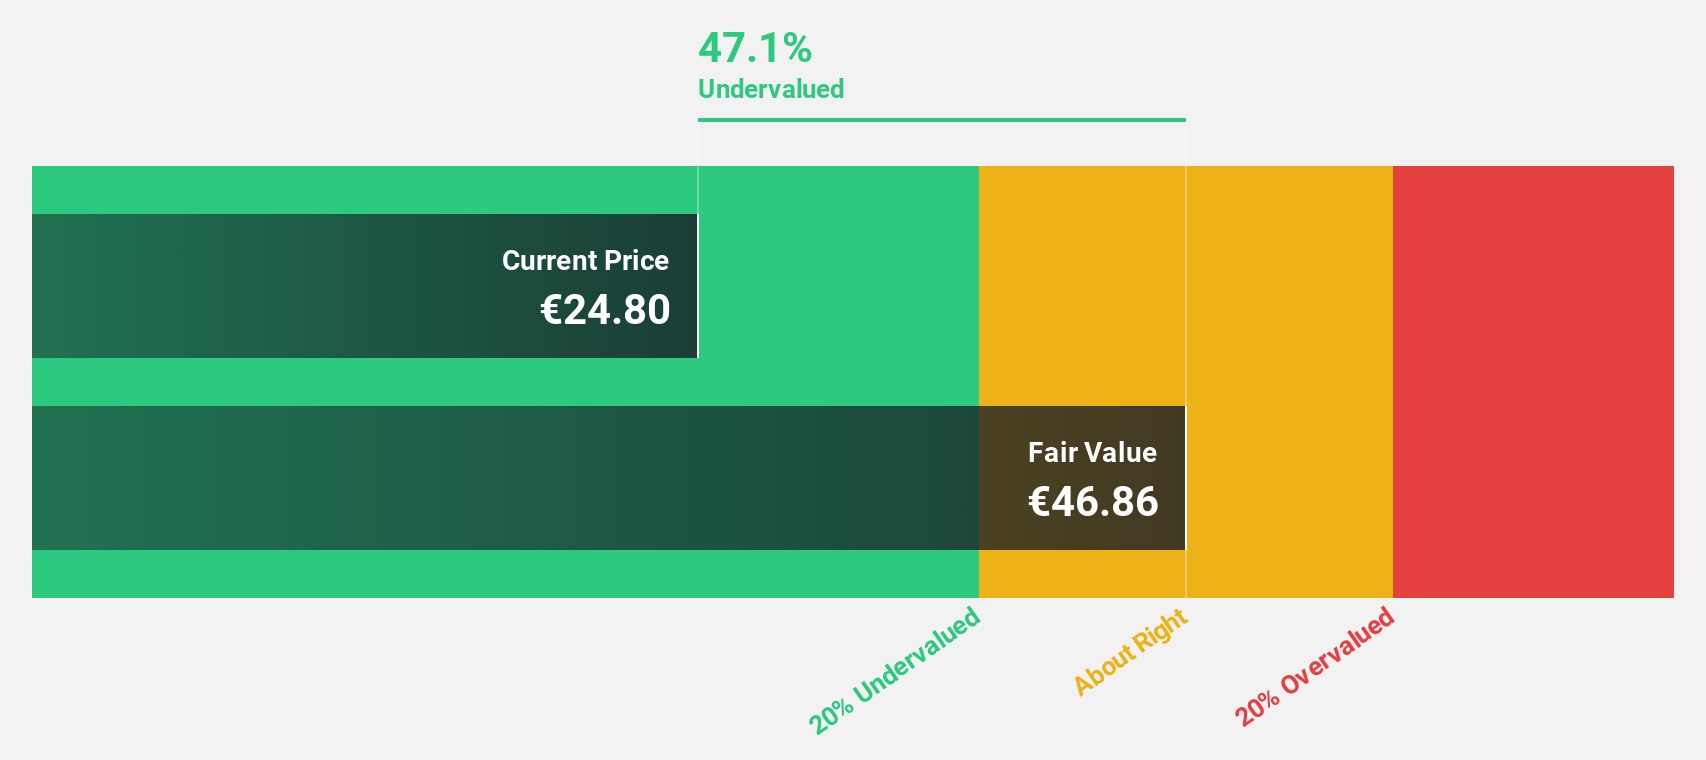
| Lectra (ENXTPA:LSS) | €24.30 | €47.47 | 48.8% |
| Tesmec (BIT:TES) | €0.0564 | €0.11 | 49.7% |
| Vestas Wind Systems (CPSE:VWS) | DKK111.75 | DKK215.27 | 48.1% |
| Claranova (ENXTPA:CLA) | €2.745 | €5.40 | 49.2% |
| MilDef Group (OM:MILDEF) | SEK227.60 | SEK440.23 | 48.3% |
| illimity Bank (BIT:ILTY) | €3.618 | €7.21 | 49.8% |
| Martela Oyj (HLSE:MARAS) | €0.758 | €1.50 | 49.5% |
| Expert.ai (BIT:EXAI) | €1.33 | €2.58 | 48.5% |
Let's dive into some prime choices out of the screener.
Tinexta (BIT:TNXT)
Overview: Tinexta S.p.A. and its subsidiaries offer digital trust, cybersecurity, and business innovation services across various regions including Italy, France, Spain, the rest of the EU, the United Kingdom, the UAE, and internationally with a market cap of €484.16 million.
Operations: The company's revenue is primarily derived from its Digital Trust services (€206.58 million), followed by Business Innovation (€151.73 million) and Cybersecurity (€106.31 million).
Estimated Discount To Fair Value: 14.9%
Tinexta is trading at €10.55, below its estimated fair value of €12.4, indicating potential undervaluation based on cash flows. Despite recent volatility and a decline in net income to €18.24 million for 2024, earnings are forecast to grow significantly at 27.5% annually, outpacing the Italian market's growth rate. However, profit margins have decreased and debt coverage by operating cash flow remains inadequate, highlighting financial challenges despite positive revenue growth projections of 7.7% annually.
- The growth report we've compiled suggests that Tinexta's future prospects could be on the up.
- Click to explore a detailed breakdown of our findings in Tinexta's balance sheet health report.
Lectra (ENXTPA:LSS)
Overview: Lectra SA offers industrial intelligence solutions for the fashion, automotive, furniture markets, and other industries globally with a market cap of €923.39 million.
Operations: The company's revenue is segmented into €176.26 million from the Americas, €134.84 million from the Asia-Pacific region, and €220.46 million from EMEA (Europe, Middle East, and Africa).
Estimated Discount To Fair Value: 48.8%
Lectra, trading at €24.3 and significantly below its fair value of €47.47, presents a strong case for undervaluation based on cash flows. Earnings are projected to grow at 20.9% annually, surpassing the French market's growth rate of 12.1%. However, revenue growth is slower at 6% per year. Recent expansion into new markets with Valia Fashion enhances operational efficiency and could drive future revenue increases despite current modest sales performance and low return on equity forecasts (12.5%).
- The analysis detailed in our Lectra growth report hints at robust future financial performance.
- Navigate through the intricacies of Lectra with our comprehensive financial health report here.
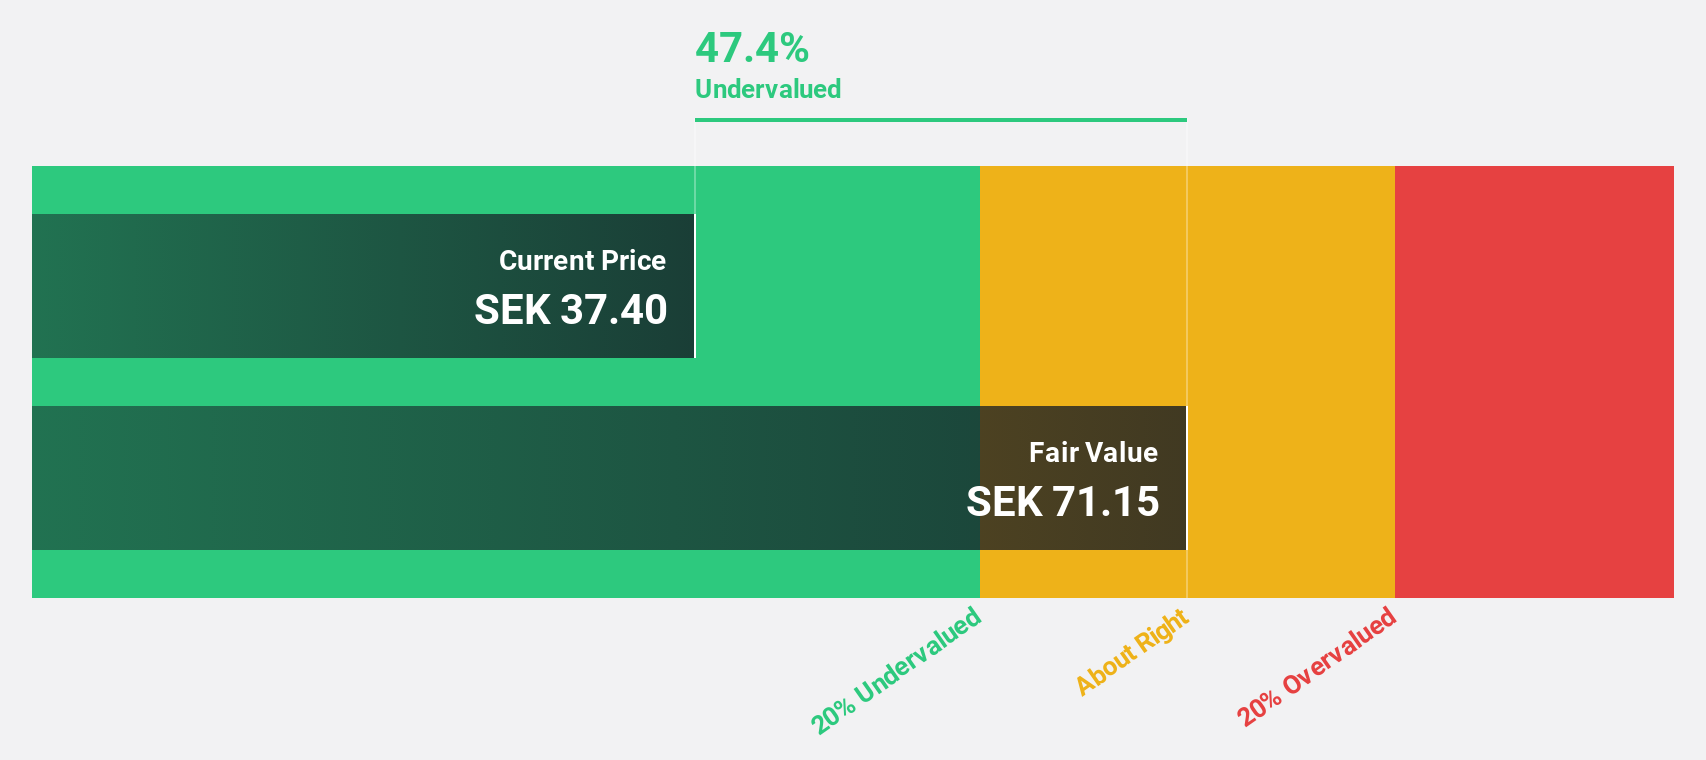
Fagerhult Group (OM:FAG)
Overview: Fagerhult Group AB, along with its subsidiaries, designs, manufactures, and markets professional lighting solutions globally and has a market cap of SEK7.72 billion.
Operations: The company's revenue segments include Premium at SEK2.77 billion, Collection at SEK3.72 billion, Professional at SEK1.02 billion, Infrastructure at SEK821.10 million, and Smart Solutions at SEK14.40 million.
Estimated Discount To Fair Value: 41.8%
Fagerhult Group, trading at SEK 43.8 and over 20% below its fair value of SEK 75.22, appears undervalued based on cash flows. Despite a recent dip in Q1 earnings and net income, the company anticipates annual profit growth of 24.1%, outpacing the Swedish market's average growth rate. However, profit margins have declined from last year, and dividend sustainability remains questionable due to an unstable track record and recent decreases.
- According our earnings growth report, there's an indication that Fagerhult Group might be ready to expand.
- Take a closer look at Fagerhult Group's balance sheet health here in our report.
Summing It All Up
- Explore the 173 names from our Undervalued European Stocks Based On Cash Flows screener here.
- Got skin in the game with these stocks? Elevate how you manage them by using Simply Wall St's portfolio, where intuitive tools await to help optimize your investment outcomes.
- Streamline your investment strategy with Simply Wall St's app for free and benefit from extensive research on stocks across all corners of the world.
Curious About Other Options?
- Explore high-performing small cap companies that haven't yet garnered significant analyst attention.
- Diversify your portfolio with solid dividend payers offering reliable income streams to weather potential market turbulence.
- Fuel your portfolio with companies showing strong growth potential, backed by optimistic outlooks both from analysts and management.
This article by Simply Wall St is general in nature. We provide commentary based on historical data and analyst forecasts only using an unbiased methodology and our articles are not intended to be financial advice. It does not constitute a recommendation to buy or sell any stock, and does not take account of your objectives, or your financial situation. We aim to bring you long-term focused analysis driven by fundamental data. Note that our analysis may not factor in the latest price-sensitive company announcements or qualitative material. Simply Wall St has no position in any stocks mentioned.
New: AI Stock Screener & Alerts
Our new AI Stock Screener scans the market every day to uncover opportunities.
• Dividend Powerhouses (3%+ Yield)
• Undervalued Small Caps with Insider Buying
• High growth Tech and AI Companies
Or build your own from over 50 metrics.
Have feedback on this article? Concerned about the content? Get in touch with us directly. Alternatively, email editorial-team@simplywallst.com
About OM:FAG
Fagerhult Group
Designs, manufactures, and markets professional lighting solutions worldwide.
Flawless balance sheet with reasonable growth potential and pays a dividend.
Similar Companies
Market Insights

Advertisement
Community Narratives

Apple: A Dying Star with an Overpriced Valuation
Fair Value US$177.34|19.1% overvalued
IN
Community Contributor
Avino a case for USD$20 per share within 5 years (assuming $3,500 gold, $100 silver and $4 copper).
Fair Value CA$26.79|86.0% undervalued
AG
Community Contributor
Riding the Defense Boom RENK Sees Revenue Climb at 15% CAGR by FY 2029
Fair Value €69.87|14.3% undervalued
CH
Community Contributor