

David Iben put it well when he said, 'Volatility is not a risk we care about. What we care about is avoiding the permanent loss of capital.' So it seems the smart money knows that debt - which is usually involved in bankruptcies - is a very important factor, when you assess how risky a company is. We note that AQ Group AB (publ) (STO:AQ) does have debt on its balance sheet. But the more important question is: how much risk is that debt creating?
Why Does Debt Bring Risk?
Generally speaking, debt only becomes a real problem when a company can't easily pay it off, either by raising capital or with its own cash flow. Ultimately, if the company can't fulfill its legal obligations to repay debt, shareholders could walk away with nothing. While that is not too common, we often do see indebted companies permanently diluting shareholders because lenders force them to raise capital at a distressed price. By replacing dilution, though, debt can be an extremely good tool for businesses that need capital to invest in growth at high rates of return. When we examine debt levels, we first consider both cash and debt levels, together.
See our latest analysis for AQ Group
What Is AQ Group's Debt?
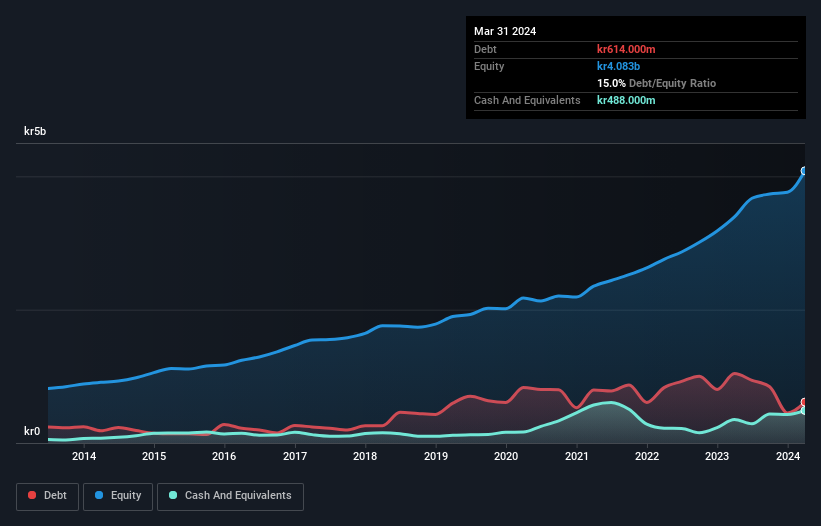
As you can see below, AQ Group had kr614.0m of debt at March 2024, down from kr1.04b a year prior. However, because it has a cash reserve of kr488.0m, its net debt is less, at about kr126.0m.
A Look At AQ Group's Liabilities
Zooming in on the latest balance sheet data, we can see that AQ Group had liabilities of kr1.74b due within 12 months and liabilities of kr541.0m due beyond that. On the other hand, it had cash of kr488.0m and kr2.28b worth of receivables due within a year. So it can boast kr479.0m more liquid assets than total liabilities.
This surplus suggests that AQ Group has a conservative balance sheet, and could probably eliminate its debt without much difficulty. Carrying virtually no net debt, AQ Group has a very light debt load indeed.
We use two main ratios to inform us about debt levels relative to earnings. The first is net debt divided by earnings before interest, tax, depreciation, and amortization (EBITDA), while the second is how many times its earnings before interest and tax (EBIT) covers its interest expense (or its interest cover, for short). The advantage of this approach is that we take into account both the absolute quantum of debt (with net debt to EBITDA) and the actual interest expenses associated with that debt (with its interest cover ratio).
AQ Group's net debt is only 0.13 times its EBITDA. And its EBIT covers its interest expense a whopping 27.4 times over. So you could argue it is no more threatened by its debt than an elephant is by a mouse. On top of that, AQ Group grew its EBIT by 73% over the last twelve months, and that growth will make it easier to handle its debt. When analysing debt levels, the balance sheet is the obvious place to start. But it is AQ Group's earnings that will influence how the balance sheet holds up in the future. So when considering debt, it's definitely worth looking at the earnings trend. Click here for an interactive snapshot.
Finally, a business needs free cash flow to pay off debt; accounting profits just don't cut it. So the logical step is to look at the proportion of that EBIT that is matched by actual free cash flow. In the last three years, AQ Group's free cash flow amounted to 44% of its EBIT, less than we'd expect. That's not great, when it comes to paying down debt.
Our View
Happily, AQ Group's impressive interest cover implies it has the upper hand on its debt. And the good news does not stop there, as its EBIT growth rate also supports that impression! Zooming out, AQ Group seems to use debt quite reasonably; and that gets the nod from us. After all, sensible leverage can boost returns on equity. Over time, share prices tend to follow earnings per share, so if you're interested in AQ Group, you may well want to click here to check an interactive graph of its earnings per share history.
If you're interested in investing in businesses that can grow profits without the burden of debt, then check out this free list of growing businesses that have net cash on the balance sheet.
New: Manage All Your Stock Portfolios in One Place
We've created the ultimate portfolio companion for stock investors, and it's free.
• Connect an unlimited number of Portfolios and see your total in one currency
• Be alerted to new Warning Signs or Risks via email or mobile
• Track the Fair Value of your stocks
Have feedback on this article? Concerned about the content? Get in touch with us directly. Alternatively, email editorial-team (at) simplywallst.com.
This article by Simply Wall St is general in nature. We provide commentary based on historical data and analyst forecasts only using an unbiased methodology and our articles are not intended to be financial advice. It does not constitute a recommendation to buy or sell any stock, and does not take account of your objectives, or your financial situation. We aim to bring you long-term focused analysis driven by fundamental data. Note that our analysis may not factor in the latest price-sensitive company announcements or qualitative material. Simply Wall St has no position in any stocks mentioned.
About OM:AQ
AQ Group
Develops, manufactures, and assembles components and systems for industrial customers in Sweden, other European countries, and internationally.
Flawless balance sheet and fair value.
Similar Companies
Market Insights

Community Narratives
