
Advertisement
- Saudi Arabia
- /
- Wireless Telecom
- /
- SASE:7020
Etihad Etisalat (TADAWUL:7020) stock performs better than its underlying earnings growth over last five years

The worst result, after buying shares in a company (assuming no leverage), would be if you lose all the money you put in. But on the bright side, you can make far more than 100% on a really good stock. One great example is Etihad Etisalat Company (TADAWUL:7020) which saw its share price drive 138% higher over five years. It's even up 8.1% in the last week. But this might be partly because the broader market had a good week last week, gaining 4.2%.
Since it's been a strong week for Etihad Etisalat shareholders, let's have a look at trend of the longer term fundamentals.
In his essay The Superinvestors of Graham-and-Doddsville Warren Buffett described how share prices do not always rationally reflect the value of a business. One imperfect but simple way to consider how the market perception of a company has shifted is to compare the change in the earnings per share (EPS) with the share price movement.
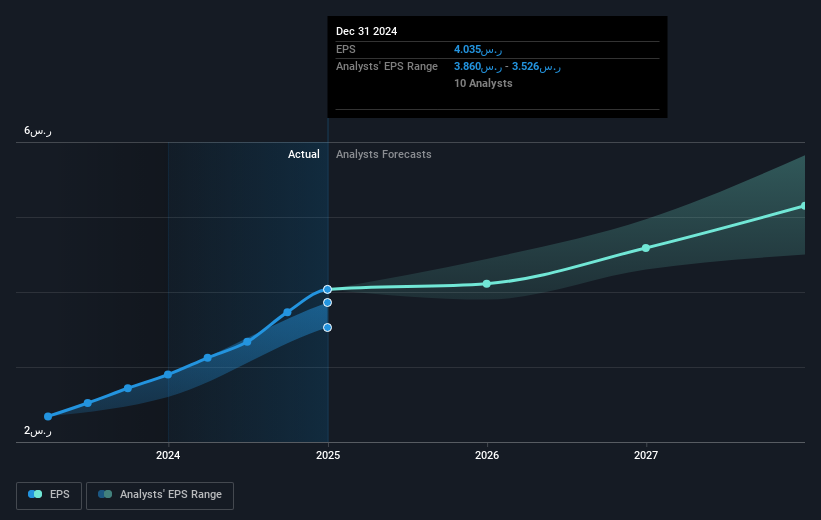
During five years of share price growth, Etihad Etisalat achieved compound earnings per share (EPS) growth of 151% per year. This EPS growth is higher than the 19% average annual increase in the share price. So one could conclude that the broader market has become more cautious towards the stock.
You can see below how EPS has changed over time (discover the exact values by clicking on the image).
We know that Etihad Etisalat has improved its bottom line over the last three years, but what does the future have in store? This free interactive report on Etihad Etisalat's balance sheet strength is a great place to start, if you want to investigate the stock further.
What About Dividends?
When looking at investment returns, it is important to consider the difference between total shareholder return (TSR) and share price return. The TSR is a return calculation that accounts for the value of cash dividends (assuming that any dividend received was reinvested) and the calculated value of any discounted capital raisings and spin-offs. Arguably, the TSR gives a more comprehensive picture of the return generated by a stock. We note that for Etihad Etisalat the TSR over the last 5 years was 171%, which is better than the share price return mentioned above. This is largely a result of its dividend payments!
A Different Perspective
We're pleased to report that Etihad Etisalat shareholders have received a total shareholder return of 16% over one year. Of course, that includes the dividend. However, that falls short of the 22% TSR per annum it has made for shareholders, each year, over five years. It's always interesting to track share price performance over the longer term. But to understand Etihad Etisalat better, we need to consider many other factors. Consider for instance, the ever-present spectre of investment risk. We've identified 1 warning sign with Etihad Etisalat , and understanding them should be part of your investment process.
We will like Etihad Etisalat better if we see some big insider buys. While we wait, check out this free list of undervalued stocks (mostly small caps) with considerable, recent, insider buying.
Please note, the market returns quoted in this article reflect the market weighted average returns of stocks that currently trade on Saudi exchanges.
Valuation is complex, but we're here to simplify it.
Discover if Etihad Etisalat might be undervalued or overvalued with our detailed analysis, featuring fair value estimates, potential risks, dividends, insider trades, and its financial condition.
Access Free AnalysisHave feedback on this article? Concerned about the content? Get in touch with us directly. Alternatively, email editorial-team (at) simplywallst.com.
This article by Simply Wall St is general in nature. We provide commentary based on historical data and analyst forecasts only using an unbiased methodology and our articles are not intended to be financial advice. It does not constitute a recommendation to buy or sell any stock, and does not take account of your objectives, or your financial situation. We aim to bring you long-term focused analysis driven by fundamental data. Note that our analysis may not factor in the latest price-sensitive company announcements or qualitative material. Simply Wall St has no position in any stocks mentioned.
About SASE:7020
Etihad Etisalat
Through its subsidiaries, establishes and operates mobile wireless telecommunication and fiber optic networks in the Kingdom of Saudi Arabia.
Excellent balance sheet and good value.
Similar Companies
Market Insights

Advertisement
Community Narratives
Pinterest will surge as advertising innovations ignite revenue growth
Fair Value US$42.63|27.1% undervalued
BR
Community Contributor
Brambles' Revenue Set to Climb 14% with Profit Margins Following
Fair Value AU$21.90|4.9% overvalued
RO
Community Contributor
Challenging Future for STG as Organic Sales Decline by 8.8%
Fair Value DKK 116.13|26.8% undervalued
KA
Community Contributor