- Saudi Arabia
- /
- Basic Materials
- /
- SASE:3008
Shareholders of Al Kathiri Holding (TADAWUL:3008) Must Be Delighted With Their 694% Total Return

Generally speaking, investors are inspired to be stock pickers by the potential to find the big winners. Mistakes are inevitable, but a single top stock pick can cover any losses, and so much more. One such superstar is Al Kathiri Holding Company (TADAWUL:3008), which saw its share price soar 320% in three years. And in the last month, the share price has gained 2.3%.
See our latest analysis for Al Kathiri Holding
To quote Buffett, 'Ships will sail around the world but the Flat Earth Society will flourish. There will continue to be wide discrepancies between price and value in the marketplace...' One imperfect but simple way to consider how the market perception of a company has shifted is to compare the change in the earnings per share (EPS) with the share price movement.
During the three years of share price growth, Al Kathiri Holding actually saw its earnings per share (EPS) drop 11% per year.
Thus, it seems unlikely that the market is focussed on EPS growth at the moment. Given this situation, it makes sense to look at other metrics too.
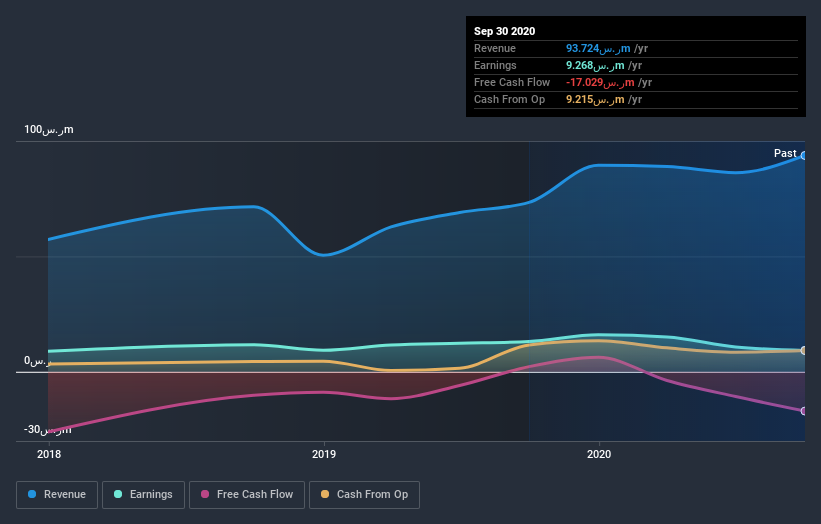
It could be that the revenue growth of 20% per year is viewed as evidence that Al Kathiri Holding is growing. In that case, the company may be sacrificing current earnings per share to drive growth, and maybe shareholder's faith in better days ahead will be rewarded.
You can see how earnings and revenue have changed over time in the image below (click on the chart to see the exact values).

You can see how its balance sheet has strengthened (or weakened) over time in this free interactive graphic.
What about the Total Shareholder Return (TSR)?
We'd be remiss not to mention the difference between Al Kathiri Holding's total shareholder return (TSR) and its share price return. The TSR is a return calculation that accounts for the value of cash dividends (assuming that any dividend received was reinvested) and the calculated value of any discounted capital raisings and spin-offs. We note that Al Kathiri Holding's TSR, at 694% is higher than its share price return of 320%. When you consider it hasn't been paying a dividend, this data suggests shareholders have benefitted from a spin-off, or had the opportunity to acquire attractively priced shares in a discounted capital raising.
A Different Perspective
Pleasingly, Al Kathiri Holding's total shareholder return last year was 108%. So this year's TSR was actually better than the three-year TSR (annualized) of 99%. These improved returns may hint at some real business momentum, implying that now could be a great time to delve deeper. I find it very interesting to look at share price over the long term as a proxy for business performance. But to truly gain insight, we need to consider other information, too. Even so, be aware that Al Kathiri Holding is showing 4 warning signs in our investment analysis , and 2 of those shouldn't be ignored...
If you are like me, then you will not want to miss this free list of growing companies that insiders are buying.
Please note, the market returns quoted in this article reflect the market weighted average returns of stocks that currently trade on SA exchanges.
If you’re looking to trade Al Kathiri Holding, open an account with the lowest-cost* platform trusted by professionals, Interactive Brokers. Their clients from over 200 countries and territories trade stocks, options, futures, forex, bonds and funds worldwide from a single integrated account. Promoted
New: Manage All Your Stock Portfolios in One Place
We've created the ultimate portfolio companion for stock investors, and it's free.
• Connect an unlimited number of Portfolios and see your total in one currency
• Be alerted to new Warning Signs or Risks via email or mobile
• Track the Fair Value of your stocks
This article by Simply Wall St is general in nature. It does not constitute a recommendation to buy or sell any stock, and does not take account of your objectives, or your financial situation. We aim to bring you long-term focused analysis driven by fundamental data. Note that our analysis may not factor in the latest price-sensitive company announcements or qualitative material. Simply Wall St has no position in any stocks mentioned.
*Interactive Brokers Rated Lowest Cost Broker by StockBrokers.com Annual Online Review 2020
Have feedback on this article? Concerned about the content? Get in touch with us directly. Alternatively, email editorial-team (at) simplywallst.com.
About SASE:3008
Al Kathiri Holding
Manufactures and sells ready-mix concrete products in the Kingdom of Saudi Arabia.
Slightly overvalued with imperfect balance sheet.
Market Insights
Community Narratives


