
Advertisement
- Saudi Arabia
- /
- Chemicals
- /
- SASE:2290
Estimating The Fair Value Of Yanbu National Petrochemical Company (TADAWUL:2290)

Key Insights
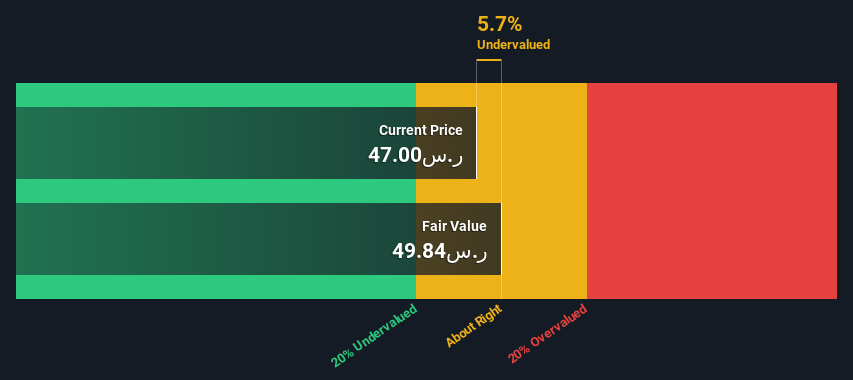
- Using the 2 Stage Free Cash Flow to Equity, Yanbu National Petrochemical fair value estimate is ر.س49.84
- Yanbu National Petrochemical's ر.س47.00 share price indicates it is trading at similar levels as its fair value estimate
- Our fair value estimate is 12% higher than Yanbu National Petrochemical's analyst price target of ر.س44.44
Does the July share price for Yanbu National Petrochemical Company (TADAWUL:2290) reflect what it's really worth? Today, we will estimate the stock's intrinsic value by projecting its future cash flows and then discounting them to today's value. This will be done using the Discounted Cash Flow (DCF) model. There's really not all that much to it, even though it might appear quite complex.
Companies can be valued in a lot of ways, so we would point out that a DCF is not perfect for every situation. Anyone interested in learning a bit more about intrinsic value should have a read of the Simply Wall St analysis model.
View our latest analysis for Yanbu National Petrochemical
The Calculation
We use what is known as a 2-stage model, which simply means we have two different periods of growth rates for the company's cash flows. Generally the first stage is higher growth, and the second stage is a lower growth phase. To start off with, we need to estimate the next ten years of cash flows. Where possible we use analyst estimates, but when these aren't available we extrapolate the previous free cash flow (FCF) from the last estimate or reported value. We assume companies with shrinking free cash flow will slow their rate of shrinkage, and that companies with growing free cash flow will see their growth rate slow, over this period. We do this to reflect that growth tends to slow more in the early years than it does in later years.
Generally we assume that a dollar today is more valuable than a dollar in the future, so we discount the value of these future cash flows to their estimated value in today's dollars:
10-year free cash flow (FCF) forecast
| 2024 | 2025 | 2026 | 2027 | 2028 | 2029 | 2030 | 2031 | 2032 | 2033 | |
| Levered FCF (SAR, Millions) | ر.س1.38b | ر.س2.07b | ر.س2.21b | ر.س2.44b | ر.س2.67b | ر.س2.92b | ر.س3.19b | ر.س3.48b | ر.س3.79b | ر.س4.13b |
| Growth Rate Estimate Source | Analyst x2 | Analyst x2 | Analyst x2 | Analyst x1 | Est @ 9.32% | Est @ 9.22% | Est @ 9.15% | Est @ 9.10% | Est @ 9.07% | Est @ 9.05% |
| Present Value (SAR, Millions) Discounted @ 16% | ر.س1.2k | ر.س1.5k | ر.س1.4k | ر.س1.4k | ر.س1.3k | ر.س1.2k | ر.س1.2k | ر.س1.1k | ر.س1.0k | ر.س965 |
("Est" = FCF growth rate estimated by Simply Wall St)
Present Value of 10-year Cash Flow (PVCF) = ر.س12b
After calculating the present value of future cash flows in the initial 10-year period, we need to calculate the Terminal Value, which accounts for all future cash flows beyond the first stage. For a number of reasons a very conservative growth rate is used that cannot exceed that of a country's GDP growth. In this case we have used the 5-year average of the 10-year government bond yield (9.0%) to estimate future growth. In the same way as with the 10-year 'growth' period, we discount future cash flows to today's value, using a cost of equity of 16%.
Terminal Value (TV)= FCF2033 × (1 + g) ÷ (r – g) = ر.س4.1b× (1 + 9.0%) ÷ (16%– 9.0%) = ر.س68b
Present Value of Terminal Value (PVTV)= TV / (1 + r)10= ر.س68b÷ ( 1 + 16%)10= ر.س16b
The total value, or equity value, is then the sum of the present value of the future cash flows, which in this case is ر.س28b. In the final step we divide the equity value by the number of shares outstanding. Relative to the current share price of ر.س47.0, the company appears about fair value at a 5.7% discount to where the stock price trades currently. Remember though, that this is just an approximate valuation, and like any complex formula - garbage in, garbage out.
The Assumptions
The calculation above is very dependent on two assumptions. The first is the discount rate and the other is the cash flows. If you don't agree with these result, have a go at the calculation yourself and play with the assumptions. The DCF also does not consider the possible cyclicality of an industry, or a company's future capital requirements, so it does not give a full picture of a company's potential performance. Given that we are looking at Yanbu National Petrochemical as potential shareholders, the cost of equity is used as the discount rate, rather than the cost of capital (or weighted average cost of capital, WACC) which accounts for debt. In this calculation we've used 16%, which is based on a levered beta of 0.931. Beta is a measure of a stock's volatility, compared to the market as a whole. We get our beta from the industry average beta of globally comparable companies, with an imposed limit between 0.8 and 2.0, which is a reasonable range for a stable business.
SWOT Analysis for Yanbu National Petrochemical
Strength
- Currently debt free.
- Dividend is in the top 25% of dividend payers in the market.
Weakness
- No major weaknesses identified for 2290.
Opportunity
- Expected to breakeven next year.
- Has sufficient cash runway for more than 3 years based on current free cash flows.
- Current share price is below our estimate of fair value.
Threat
- Paying a dividend but company is unprofitable.
Moving On:
Valuation is only one side of the coin in terms of building your investment thesis, and it is only one of many factors that you need to assess for a company. The DCF model is not a perfect stock valuation tool. Preferably you'd apply different cases and assumptions and see how they would impact the company's valuation. For instance, if the terminal value growth rate is adjusted slightly, it can dramatically alter the overall result. For Yanbu National Petrochemical, we've compiled three important factors you should explore:
- Risks: For example, we've discovered 1 warning sign for Yanbu National Petrochemical that you should be aware of before investing here.
- Future Earnings: How does 2290's growth rate compare to its peers and the wider market? Dig deeper into the analyst consensus number for the upcoming years by interacting with our free analyst growth expectation chart.
- Other High Quality Alternatives: Do you like a good all-rounder? Explore our interactive list of high quality stocks to get an idea of what else is out there you may be missing!
PS. The Simply Wall St app conducts a discounted cash flow valuation for every stock on the SASE every day. If you want to find the calculation for other stocks just search here.
New: Manage All Your Stock Portfolios in One Place
We've created the ultimate portfolio companion for stock investors, and it's free.
• Connect an unlimited number of Portfolios and see your total in one currency
• Be alerted to new Warning Signs or Risks via email or mobile
• Track the Fair Value of your stocks
Have feedback on this article? Concerned about the content? Get in touch with us directly. Alternatively, email editorial-team (at) simplywallst.com.
This article by Simply Wall St is general in nature. We provide commentary based on historical data and analyst forecasts only using an unbiased methodology and our articles are not intended to be financial advice. It does not constitute a recommendation to buy or sell any stock, and does not take account of your objectives, or your financial situation. We aim to bring you long-term focused analysis driven by fundamental data. Note that our analysis may not factor in the latest price-sensitive company announcements or qualitative material. Simply Wall St has no position in any stocks mentioned.
About SASE:2290
Yanbu National Petrochemical
Manufactures and sells petrochemical products in the Kingdom of Saudi Arabia, the United States, Africa, the Middle East, Europe, and Asia.
Flawless balance sheet with reasonable growth potential.
Market Insights

Advertisement
Community Narratives
Scaling up in building materials with smart M&A and growing profitability
Fair Value US$2.77|24.5% undervalued
CM
Community Contributor
Hims: The Platform Powering Personalised Healthcare
Fair Value US$114.01|45.3% undervalued
BL
Community Contributor
Undervalued lottery company with strong fundamentals
Fair Value AU$15.00|33.9% undervalued
RO
Community Contributor
Proximus, transferring money from the impatient to the patient investor
Fair Value €16.62|57.0% undervalued
AX
Community Contributor