- Saudi Arabia
- /
- Insurance
- /
- SASE:8050
Salama Cooperative Insurance (TADAWUL:8050 shareholders incur further losses as stock declines 10% this week, taking three-year losses to 18%


Many investors define successful investing as beating the market average over the long term. But the risk of stock picking is that you will likely buy under-performing companies. Unfortunately, that's been the case for longer term Salama Cooperative Insurance Company (TADAWUL:8050) shareholders, since the share price is down 55% in the last three years, falling well short of the market decline of around 8.4%. And the ride hasn't got any smoother in recent times over the last year, with the price 37% lower in that time. The falls have accelerated recently, with the share price down 20% in the last three months.
After losing 10% this past week, it's worth investigating the company's fundamentals to see what we can infer from past performance.
View our latest analysis for Salama Cooperative Insurance
To quote Buffett, 'Ships will sail around the world but the Flat Earth Society will flourish. There will continue to be wide discrepancies between price and value in the marketplace...' By comparing earnings per share (EPS) and share price changes over time, we can get a feel for how investor attitudes to a company have morphed over time.
During five years of share price growth, Salama Cooperative Insurance moved from a loss to profitability. That would generally be considered a positive, so we are surprised to see the share price is down. So given the share price is down it's worth checking some other metrics too.
We note that, in three years, revenue has actually grown at a 24% annual rate, so that doesn't seem to be a reason to sell shares. This analysis is just perfunctory, but it might be worth researching Salama Cooperative Insurance more closely, as sometimes stocks fall unfairly. This could present an opportunity.
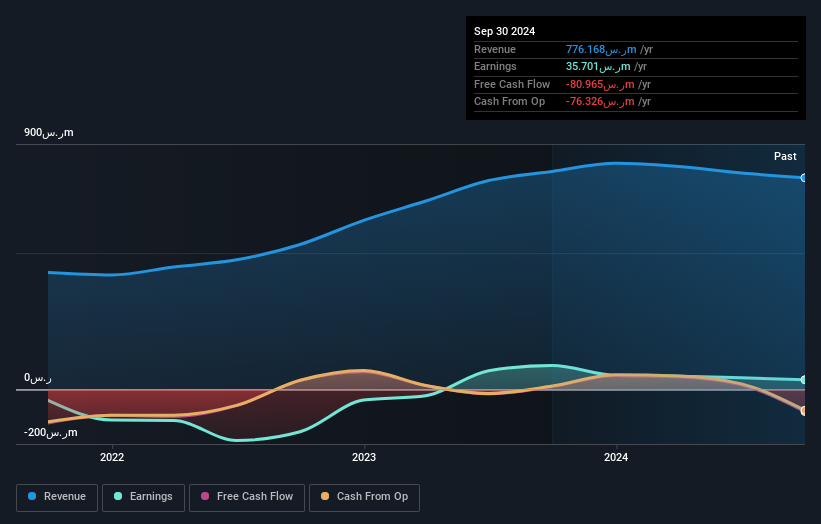
The graphic below depicts how earnings and revenue have changed over time (unveil the exact values by clicking on the image).
You can see how its balance sheet has strengthened (or weakened) over time in this free interactive graphic.
What About The Total Shareholder Return (TSR)?
We'd be remiss not to mention the difference between Salama Cooperative Insurance's total shareholder return (TSR) and its share price return. Arguably the TSR is a more complete return calculation because it accounts for the value of dividends (as if they were reinvested), along with the hypothetical value of any discounted capital that have been offered to shareholders. Salama Cooperative Insurance hasn't been paying dividends, but its TSR of -18% exceeds its share price return of -55%, implying it has either spun-off a business, or raised capital at a discount; thereby providing additional value to shareholders.
A Different Perspective
While the broader market lost about 6.1% in the twelve months, Salama Cooperative Insurance shareholders did even worse, losing 24%. Having said that, it's inevitable that some stocks will be oversold in a falling market. The key is to keep your eyes on the fundamental developments. Longer term investors wouldn't be so upset, since they would have made 4%, each year, over five years. It could be that the recent sell-off is an opportunity, so it may be worth checking the fundamental data for signs of a long term growth trend. While it is well worth considering the different impacts that market conditions can have on the share price, there are other factors that are even more important. Consider for instance, the ever-present spectre of investment risk. We've identified 3 warning signs with Salama Cooperative Insurance (at least 2 which are concerning) , and understanding them should be part of your investment process.
If you are like me, then you will not want to miss this free list of undervalued small caps that insiders are buying.
Please note, the market returns quoted in this article reflect the market weighted average returns of stocks that currently trade on Saudi exchanges.
New: Manage All Your Stock Portfolios in One Place
We've created the ultimate portfolio companion for stock investors, and it's free.
• Connect an unlimited number of Portfolios and see your total in one currency
• Be alerted to new Warning Signs or Risks via email or mobile
• Track the Fair Value of your stocks
Have feedback on this article? Concerned about the content? Get in touch with us directly. Alternatively, email editorial-team (at) simplywallst.com.
This article by Simply Wall St is general in nature. We provide commentary based on historical data and analyst forecasts only using an unbiased methodology and our articles are not intended to be financial advice. It does not constitute a recommendation to buy or sell any stock, and does not take account of your objectives, or your financial situation. We aim to bring you long-term focused analysis driven by fundamental data. Note that our analysis may not factor in the latest price-sensitive company announcements or qualitative material. Simply Wall St has no position in any stocks mentioned.
About SASE:8050
Salama Cooperative Insurance
Provides insurance products and services in the Kingdom of Saudi Arabia and internationally.
Flawless balance sheet low.
Market Insights

Community Narratives
