- Saudi Arabia
- /
- Food
- /
- SASE:2050
The one-year decline in earnings for Savola Group TADAWUL:2050) isn't encouraging, but shareholders are still up 5.9% over that period


Most people feel a little frustrated if a stock they own goes down in price. But in the short term the market is a voting machine, and the share price movements may not reflect the underlying business performance. So while the Savola Group Company (TADAWUL:2050) share price is down 82% in the last year, the total return to shareholders (which includes dividends) was 5.9%. And that total return actually beats the market decline of 5.5%. Even if you look out three years, the returns are still disappointing, with the share price down73% in that time. Furthermore, it's down 62% in about a quarter. That's not much fun for holders. We really hope anyone holding through that price crash has a diversified portfolio. Even when you lose money, you don't have to lose the lesson.
If the past week is anything to go by, investor sentiment for Savola Group isn't positive, so let's see if there's a mismatch between fundamentals and the share price.
See our latest analysis for Savola Group
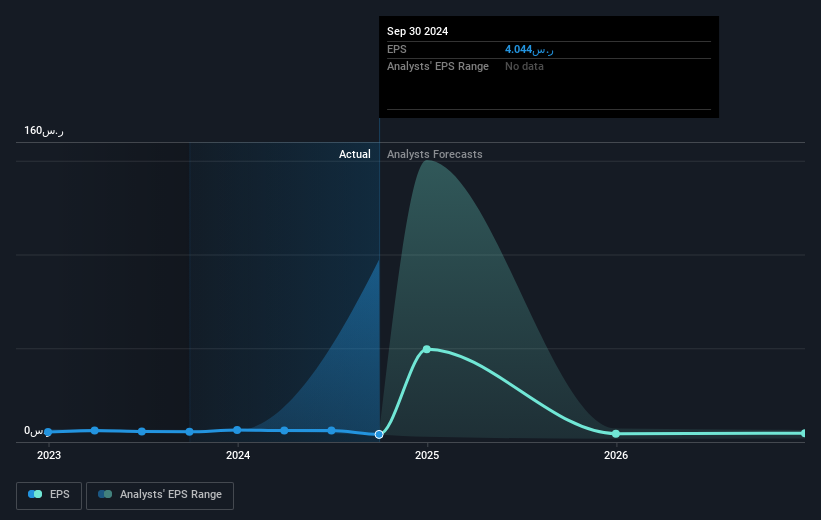
To paraphrase Benjamin Graham: Over the short term the market is a voting machine, but over the long term it's a weighing machine. One way to examine how market sentiment has changed over time is to look at the interaction between a company's share price and its earnings per share (EPS).
Unfortunately Savola Group reported an EPS drop of 26% for the last year. This reduction in EPS is not as bad as the 82% share price fall. This suggests the EPS fall has made some shareholders more nervous about the business.
The company's earnings per share (over time) is depicted in the image below (click to see the exact numbers).
Before buying or selling a stock, we always recommend a close examination of historic growth trends, available here.
What About Dividends?
When looking at investment returns, it is important to consider the difference between total shareholder return (TSR) and share price return. The TSR incorporates the value of any spin-offs or discounted capital raisings, along with any dividends, based on the assumption that the dividends are reinvested. So for companies that pay a generous dividend, the TSR is often a lot higher than the share price return. In the case of Savola Group, it has a TSR of 5.9% for the last 1 year. That exceeds its share price return that we previously mentioned. And there's no prize for guessing that the dividend payments largely explain the divergence!
A Different Perspective
We're pleased to report that Savola Group shareholders have received a total shareholder return of 5.9% over one year. And that does include the dividend. However, that falls short of the 13% TSR per annum it has made for shareholders, each year, over five years. The pessimistic view would be that be that the stock has its best days behind it, but on the other hand the price might simply be moderating while the business itself continues to execute. While it is well worth considering the different impacts that market conditions can have on the share price, there are other factors that are even more important. Case in point: We've spotted 4 warning signs for Savola Group you should be aware of, and 3 of them make us uncomfortable.
For those who like to find winning investments this free list of undervalued companies with recent insider purchasing, could be just the ticket.
Please note, the market returns quoted in this article reflect the market weighted average returns of stocks that currently trade on Saudi exchanges.
New: Manage All Your Stock Portfolios in One Place
We've created the ultimate portfolio companion for stock investors, and it's free.
• Connect an unlimited number of Portfolios and see your total in one currency
• Be alerted to new Warning Signs or Risks via email or mobile
• Track the Fair Value of your stocks
Have feedback on this article? Concerned about the content? Get in touch with us directly. Alternatively, email editorial-team (at) simplywallst.com.
This article by Simply Wall St is general in nature. We provide commentary based on historical data and analyst forecasts only using an unbiased methodology and our articles are not intended to be financial advice. It does not constitute a recommendation to buy or sell any stock, and does not take account of your objectives, or your financial situation. We aim to bring you long-term focused analysis driven by fundamental data. Note that our analysis may not factor in the latest price-sensitive company announcements or qualitative material. Simply Wall St has no position in any stocks mentioned.
About SASE:2050
Excellent balance sheet with proven track record and pays a dividend.
Market Insights

Community Narratives
