- Saudi Arabia
- /
- Hospitality
- /
- SASE:1830
Does This Valuation Of Leejam Sports Company (TADAWUL:1830) Imply Investors Are Overpaying?


Key Insights
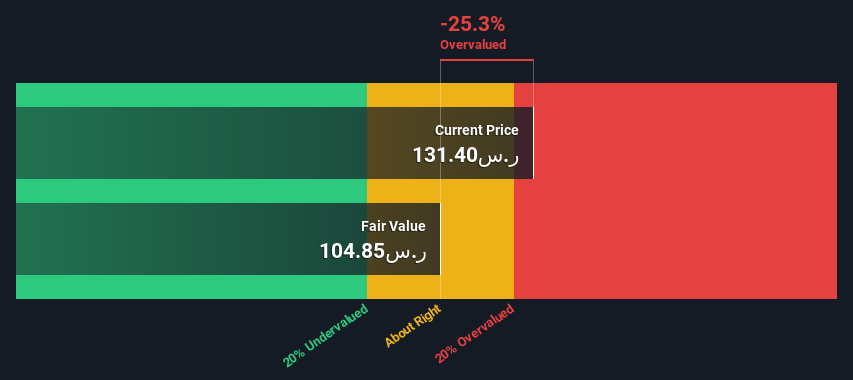
- Leejam Sports' estimated fair value is ر.س105 based on 2 Stage Free Cash Flow to Equity
- Leejam Sports' ر.س131 share price signals that it might be 25% overvalued
- The ر.س127 analyst price target for 1830 is 22% more than our estimate of fair value
Today we will run through one way of estimating the intrinsic value of Leejam Sports Company (TADAWUL:1830) by projecting its future cash flows and then discounting them to today's value. One way to achieve this is by employing the Discounted Cash Flow (DCF) model. There's really not all that much to it, even though it might appear quite complex.
We would caution that there are many ways of valuing a company and, like the DCF, each technique has advantages and disadvantages in certain scenarios. If you want to learn more about discounted cash flow, the rationale behind this calculation can be read in detail in the Simply Wall St analysis model.
View our latest analysis for Leejam Sports
Is Leejam Sports Fairly Valued?
We use what is known as a 2-stage model, which simply means we have two different periods of growth rates for the company's cash flows. Generally the first stage is higher growth, and the second stage is a lower growth phase. In the first stage we need to estimate the cash flows to the business over the next ten years. Where possible we use analyst estimates, but when these aren't available we extrapolate the previous free cash flow (FCF) from the last estimate or reported value. We assume companies with shrinking free cash flow will slow their rate of shrinkage, and that companies with growing free cash flow will see their growth rate slow, over this period. We do this to reflect that growth tends to slow more in the early years than it does in later years.
A DCF is all about the idea that a dollar in the future is less valuable than a dollar today, so we discount the value of these future cash flows to their estimated value in today's dollars:
10-year free cash flow (FCF) forecast
| 2023 | 2024 | 2025 | 2026 | 2027 | 2028 | 2029 | 2030 | 2031 | 2032 | |
| Levered FCF (SAR, Millions) | ر.س306.7m | ر.س379.0m | ر.س434.3m | ر.س533.0m | ر.س612.0m | ر.س682.9m | ر.س756.7m | ر.س834.4m | ر.س916.9m | ر.س1.01b |
| Growth Rate Estimate Source | Analyst x3 | Analyst x3 | Analyst x3 | Analyst x1 | Analyst x1 | Est @ 11.59% | Est @ 10.81% | Est @ 10.26% | Est @ 9.88% | Est @ 9.61% |
| Present Value (SAR, Millions) Discounted @ 17% | ر.س262 | ر.س277 | ر.س272 | ر.س286 | ر.س281 | ر.س268 | ر.س254 | ر.س240 | ر.س225 | ر.س211 |
("Est" = FCF growth rate estimated by Simply Wall St)
Present Value of 10-year Cash Flow (PVCF) = ر.س2.6b
We now need to calculate the Terminal Value, which accounts for all the future cash flows after this ten year period. For a number of reasons a very conservative growth rate is used that cannot exceed that of a country's GDP growth. In this case we have used the 5-year average of the 10-year government bond yield (9.0%) to estimate future growth. In the same way as with the 10-year 'growth' period, we discount future cash flows to today's value, using a cost of equity of 17%.
Terminal Value (TV)= FCF2032 × (1 + g) ÷ (r – g) = ر.س1.0b× (1 + 9.0%) ÷ (17%– 9.0%) = ر.س14b
Present Value of Terminal Value (PVTV)= TV / (1 + r)10= ر.س14b÷ ( 1 + 17%)10= ر.س2.9b
The total value is the sum of cash flows for the next ten years plus the discounted terminal value, which results in the Total Equity Value, which in this case is ر.س5.5b. The last step is to then divide the equity value by the number of shares outstanding. Relative to the current share price of ر.س131, the company appears slightly overvalued at the time of writing. Remember though, that this is just an approximate valuation, and like any complex formula - garbage in, garbage out.
The Assumptions
The calculation above is very dependent on two assumptions. The first is the discount rate and the other is the cash flows. You don't have to agree with these inputs, I recommend redoing the calculations yourself and playing with them. The DCF also does not consider the possible cyclicality of an industry, or a company's future capital requirements, so it does not give a full picture of a company's potential performance. Given that we are looking at Leejam Sports as potential shareholders, the cost of equity is used as the discount rate, rather than the cost of capital (or weighted average cost of capital, WACC) which accounts for debt. In this calculation we've used 17%, which is based on a levered beta of 1.102. Beta is a measure of a stock's volatility, compared to the market as a whole. We get our beta from the industry average beta of globally comparable companies, with an imposed limit between 0.8 and 2.0, which is a reasonable range for a stable business.
SWOT Analysis for Leejam Sports
- Earnings growth over the past year exceeded the industry.
- Debt is not viewed as a risk.
- Dividends are covered by earnings and cash flows.
- Earnings growth over the past year is below its 5-year average.
- Dividend is low compared to the top 25% of dividend payers in the Hospitality market.
- Annual earnings are forecast to grow faster than the Saudi market.
- Good value based on P/E ratio compared to estimated Fair P/E ratio.
- Revenue is forecast to grow slower than 20% per year.
Moving On:
Valuation is only one side of the coin in terms of building your investment thesis, and it is only one of many factors that you need to assess for a company. DCF models are not the be-all and end-all of investment valuation. Preferably you'd apply different cases and assumptions and see how they would impact the company's valuation. For example, changes in the company's cost of equity or the risk free rate can significantly impact the valuation. What is the reason for the share price exceeding the intrinsic value? For Leejam Sports, we've compiled three important items you should look at:
- Risks: Take risks, for example - Leejam Sports has 1 warning sign we think you should be aware of.
- Future Earnings: How does 1830's growth rate compare to its peers and the wider market? Dig deeper into the analyst consensus number for the upcoming years by interacting with our free analyst growth expectation chart.
- Other High Quality Alternatives: Do you like a good all-rounder? Explore our interactive list of high quality stocks to get an idea of what else is out there you may be missing!
PS. The Simply Wall St app conducts a discounted cash flow valuation for every stock on the SASE every day. If you want to find the calculation for other stocks just search here.
New: AI Stock Screener & Alerts
Our new AI Stock Screener scans the market every day to uncover opportunities.
• Dividend Powerhouses (3%+ Yield)
• Undervalued Small Caps with Insider Buying
• High growth Tech and AI Companies
Or build your own from over 50 metrics.
Have feedback on this article? Concerned about the content? Get in touch with us directly. Alternatively, email editorial-team (at) simplywallst.com.
This article by Simply Wall St is general in nature. We provide commentary based on historical data and analyst forecasts only using an unbiased methodology and our articles are not intended to be financial advice. It does not constitute a recommendation to buy or sell any stock, and does not take account of your objectives, or your financial situation. We aim to bring you long-term focused analysis driven by fundamental data. Note that our analysis may not factor in the latest price-sensitive company announcements or qualitative material. Simply Wall St has no position in any stocks mentioned.
About SASE:1830
Leejam Sports
Operates sports and fitness centers in the Kingdom of Saudi Arabia and the United Arab Emirates.
Solid track record with adequate balance sheet.
