
Advertisement
To avoid investing in a business that's in decline, there's a few financial metrics that can provide early indications of aging. Businesses in decline often have two underlying trends, firstly, a declining return on capital employed (ROCE) and a declining base of capital employed. Trends like this ultimately mean the business is reducing its investments and also earning less on what it has invested. So after glancing at the trends within IAR (BVB:IARV), we weren't too hopeful.
Understanding Return On Capital Employed (ROCE)
If you haven't worked with ROCE before, it measures the 'return' (pre-tax profit) a company generates from capital employed in its business. Analysts use this formula to calculate it for IAR:
Return on Capital Employed = Earnings Before Interest and Tax (EBIT) ÷ (Total Assets - Current Liabilities)
0.053 = RON16m ÷ (RON657m - RON356m) (Based on the trailing twelve months to December 2022).
Therefore, IAR has an ROCE of 5.3%. Ultimately, that's a low return and it under-performs the Aerospace & Defense industry average of 9.6%.
See our latest analysis for IAR
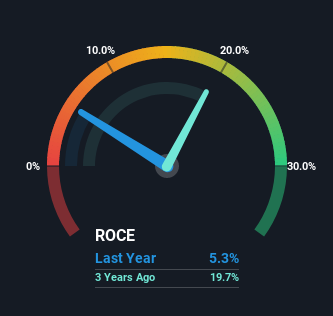
Historical performance is a great place to start when researching a stock so above you can see the gauge for IAR's ROCE against it's prior returns. If you want to delve into the historical earnings, revenue and cash flow of IAR, check out these free graphs here.
What The Trend Of ROCE Can Tell Us
In terms of IAR's historical ROCE movements, the trend doesn't inspire confidence. To be more specific, the ROCE was 9.7% five years ago, but since then it has dropped noticeably. On top of that, it's worth noting that the amount of capital employed within the business has remained relatively steady. Since returns are falling and the business has the same amount of assets employed, this can suggest it's a mature business that hasn't had much growth in the last five years. So because these trends aren't typically conducive to creating a multi-bagger, we wouldn't hold our breath on IAR becoming one if things continue as they have.
On a side note, IAR's current liabilities have increased over the last five years to 54% of total assets, effectively distorting the ROCE to some degree. Without this increase, it's likely that ROCE would be even lower than 5.3%. And with current liabilities at these levels, suppliers or short-term creditors are effectively funding a large part of the business, which can introduce some risks.
The Key Takeaway
All in all, the lower returns from the same amount of capital employed aren't exactly signs of a compounding machine. But investors must be expecting an improvement of sorts because over the last five yearsthe stock has delivered a respectable 67% return. Regardless, we don't feel too comfortable with the fundamentals so we'd be steering clear of this stock for now.
Since virtually every company faces some risks, it's worth knowing what they are, and we've spotted 4 warning signs for IAR (of which 1 makes us a bit uncomfortable!) that you should know about.
While IAR may not currently earn the highest returns, we've compiled a list of companies that currently earn more than 25% return on equity. Check out this free list here.
New: AI Stock Screener & Alerts
Our new AI Stock Screener scans the market every day to uncover opportunities.
• Dividend Powerhouses (3%+ Yield)
• Undervalued Small Caps with Insider Buying
• High growth Tech and AI Companies
Or build your own from over 50 metrics.
Have feedback on this article? Concerned about the content? Get in touch with us directly. Alternatively, email editorial-team (at) simplywallst.com.
This article by Simply Wall St is general in nature. We provide commentary based on historical data and analyst forecasts only using an unbiased methodology and our articles are not intended to be financial advice. It does not constitute a recommendation to buy or sell any stock, and does not take account of your objectives, or your financial situation. We aim to bring you long-term focused analysis driven by fundamental data. Note that our analysis may not factor in the latest price-sensitive company announcements or qualitative material. Simply Wall St has no position in any stocks mentioned.
About BVB:IARV
Flawless balance sheet with acceptable track record.
Similar Companies
Market Insights

Advertisement
Community Narratives
Quality at a Premium. A time to watch, not to buy?
Fair Value US$154.56|29.9% undervalued
DA
Community Contributor
GRAB: The Super-App at the Heart of Southeast Asia’s Digital Boom
Fair Value US$8.20|22.9% undervalued
BL
Community Contributor
Verve Group to Surge with 51.61% Revenue Growth
Fair Value €6.00|64.1% undervalued
ME
Community Contributor