
If we're looking to avoid a business that is in decline, what are the trends that can warn us ahead of time? Typically, we'll see the trend of both return on capital employed (ROCE) declining and this usually coincides with a decreasing amount of capital employed. Ultimately this means that the company is earning less per dollar invested and on top of that, it's shrinking its base of capital employed. And from a first read, things don't look too good at S.C. UAMT (BVB:UAM), so let's see why.
Understanding Return On Capital Employed (ROCE)
For those who don't know, ROCE is a measure of a company's yearly pre-tax profit (its return), relative to the capital employed in the business. The formula for this calculation on S.C. UAMT is:
Return on Capital Employed = Earnings Before Interest and Tax (EBIT) ÷ (Total Assets - Current Liabilities)
0.011 = RON923k ÷ (RON90m - RON4.6m) (Based on the trailing twelve months to December 2023).
Thus, S.C. UAMT has an ROCE of 1.1%. Even though it's in line with the industry average of 1.4%, it's still a low return by itself.
Check out our latest analysis for S.C. UAMT
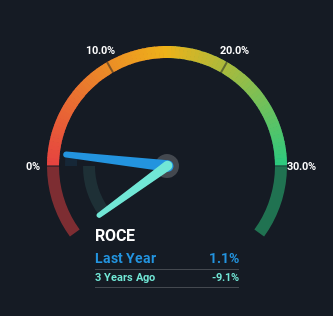
While the past is not representative of the future, it can be helpful to know how a company has performed historically, which is why we have this chart above. If you'd like to look at how S.C. UAMT has performed in the past in other metrics, you can view this free graph of S.C. UAMT's past earnings, revenue and cash flow.
What Does the ROCE Trend For S.C. UAMT Tell Us?
We are a bit anxious about the trends of ROCE at S.C. UAMT. To be more specific, today's ROCE was 2.5% five years ago but has since fallen to 1.1%. What's equally concerning is that the amount of capital deployed in the business has shrunk by 29% over that same period. The combination of lower ROCE and less capital employed can indicate that a business is likely to be facing some competitive headwinds or seeing an erosion to its moat. Typically businesses that exhibit these characteristics aren't the ones that tend to multiply over the long term, because statistically speaking, they've already gone through the growth phase of their life cycle.
On a side note, S.C. UAMT has done well to pay down its current liabilities to 5.1% of total assets. That could partly explain why the ROCE has dropped. Effectively this means their suppliers or short-term creditors are funding less of the business, which reduces some elements of risk. Since the business is basically funding more of its operations with it's own money, you could argue this has made the business less efficient at generating ROCE.
The Bottom Line
To see S.C. UAMT reducing the capital employed in the business in tandem with diminishing returns, is concerning. Investors haven't taken kindly to these developments, since the stock has declined 68% from where it was five years ago. Unless there is a shift to a more positive trajectory in these metrics, we would look elsewhere.
On a final note, we found 2 warning signs for S.C. UAMT (1 makes us a bit uncomfortable) you should be aware of.
While S.C. UAMT may not currently earn the highest returns, we've compiled a list of companies that currently earn more than 25% return on equity. Check out this free list here.
The New Payments ETF Is Live on NASDAQ:
Money is moving to real-time rails, and a newly listed ETF now gives investors direct exposure. Fast settlement. Institutional custody. Simple access.
Explore how this launch could reshape portfolios
Sponsored ContentNew: Manage All Your Stock Portfolios in One Place
We've created the ultimate portfolio companion for stock investors, and it's free.
• Connect an unlimited number of Portfolios and see your total in one currency
• Be alerted to new Warning Signs or Risks via email or mobile
• Track the Fair Value of your stocks
Have feedback on this article? Concerned about the content? Get in touch with us directly. Alternatively, email editorial-team (at) simplywallst.com.
This article by Simply Wall St is general in nature. We provide commentary based on historical data and analyst forecasts only using an unbiased methodology and our articles are not intended to be financial advice. It does not constitute a recommendation to buy or sell any stock, and does not take account of your objectives, or your financial situation. We aim to bring you long-term focused analysis driven by fundamental data. Note that our analysis may not factor in the latest price-sensitive company announcements or qualitative material. Simply Wall St has no position in any stocks mentioned.
About BVB:UAM
S.C. UAMT
Manufactures and sells other parts and accessories for motor vehicles and motor vehicle engines in Europe and internationally.
Excellent balance sheet with low risk.
Market Insights

Weekly Picks

THE KINGDOM OF BROWN GOODS: WHY MGPI IS BEING CRUSHED BY INVENTORY & PRIMED FOR RESURRECTION


Why Vertical Aerospace (NYSE: EVTL) is Worth Possibly Over 13x its Current Price


The Quiet Giant That Became AI’s Power Grid
Recently Updated Narratives


MINISO's fair value is projected at 26.69 with an anticipated PE ratio shift of 20x

Fiverr International will transform the freelance industry with AI-powered growth

Stride Stock: Online Education Finds Its Second Act
Popular Narratives


MicroVision will explode future revenue by 380.37% with a vision towards success


Crazy Undervalued 42 Baggers Silver Play (Active & Running Mine)


