Masraf Al Rayan (Q.P.S.C.) (DSM:MARK) investors are sitting on a loss of 47% if they invested a year ago


Investors can approximate the average market return by buying an index fund. When you buy individual stocks, you can make higher profits, but you also face the risk of under-performance. Investors in Masraf Al Rayan (Q.P.S.C.) (DSM:MARK) have tasted that bitter downside in the last year, as the share price dropped 49%. That contrasts poorly with the market decline of 19%. We note that it has not been easy for shareholders over three years, either; the share price is down 41% in that time. The falls have accelerated recently, with the share price down 10% in the last three months.
It's worthwhile assessing if the company's economics have been moving in lockstep with these underwhelming shareholder returns, or if there is some disparity between the two. So let's do just that.
Check out our latest analysis for Masraf Al Rayan (Q.P.S.C.)
While the efficient markets hypothesis continues to be taught by some, it has been proven that markets are over-reactive dynamic systems, and investors are not always rational. One flawed but reasonable way to assess how sentiment around a company has changed is to compare the earnings per share (EPS) with the share price.
Unhappily, Masraf Al Rayan (Q.P.S.C.) had to report a 36% decline in EPS over the last year. The share price decline of 49% is actually more than the EPS drop. So it seems the market was too confident about the business, a year ago.
You can see below how EPS has changed over time (discover the exact values by clicking on the image).
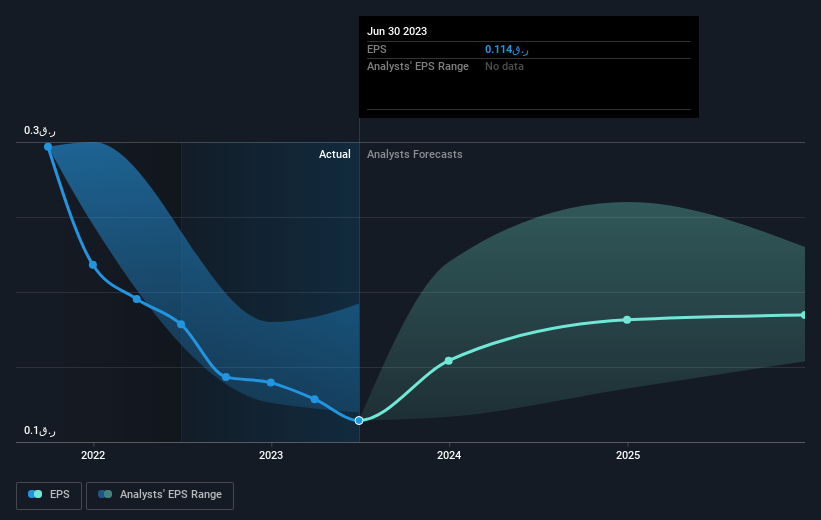
Dive deeper into Masraf Al Rayan (Q.P.S.C.)'s key metrics by checking this interactive graph of Masraf Al Rayan (Q.P.S.C.)'s earnings, revenue and cash flow.
What About Dividends?
It is important to consider the total shareholder return, as well as the share price return, for any given stock. Whereas the share price return only reflects the change in the share price, the TSR includes the value of dividends (assuming they were reinvested) and the benefit of any discounted capital raising or spin-off. It's fair to say that the TSR gives a more complete picture for stocks that pay a dividend. In the case of Masraf Al Rayan (Q.P.S.C.), it has a TSR of -47% for the last 1 year. That exceeds its share price return that we previously mentioned. This is largely a result of its dividend payments!
A Different Perspective
We regret to report that Masraf Al Rayan (Q.P.S.C.) shareholders are down 47% for the year (even including dividends). Unfortunately, that's worse than the broader market decline of 19%. Having said that, it's inevitable that some stocks will be oversold in a falling market. The key is to keep your eyes on the fundamental developments. Regrettably, last year's performance caps off a bad run, with the shareholders facing a total loss of 3% per year over five years. We realise that Baron Rothschild has said investors should "buy when there is blood on the streets", but we caution that investors should first be sure they are buying a high quality business. I find it very interesting to look at share price over the long term as a proxy for business performance. But to truly gain insight, we need to consider other information, too. Even so, be aware that Masraf Al Rayan (Q.P.S.C.) is showing 2 warning signs in our investment analysis , you should know about...
If you are like me, then you will not want to miss this free list of growing companies that insiders are buying.
Please note, the market returns quoted in this article reflect the market weighted average returns of stocks that currently trade on Qatari exchanges.
If you're looking to trade Masraf Al Rayan (Q.P.S.C.), open an account with the lowest-cost platform trusted by professionals, Interactive Brokers.
With clients in over 200 countries and territories, and access to 160 markets, IBKR lets you trade stocks, options, futures, forex, bonds and funds from a single integrated account.
Enjoy no hidden fees, no account minimums, and FX conversion rates as low as 0.03%, far better than what most brokers offer.
Sponsored ContentNew: Manage All Your Stock Portfolios in One Place
We've created the ultimate portfolio companion for stock investors, and it's free.
• Connect an unlimited number of Portfolios and see your total in one currency
• Be alerted to new Warning Signs or Risks via email or mobile
• Track the Fair Value of your stocks
Have feedback on this article? Concerned about the content? Get in touch with us directly. Alternatively, email editorial-team (at) simplywallst.com.
This article by Simply Wall St is general in nature. We provide commentary based on historical data and analyst forecasts only using an unbiased methodology and our articles are not intended to be financial advice. It does not constitute a recommendation to buy or sell any stock, and does not take account of your objectives, or your financial situation. We aim to bring you long-term focused analysis driven by fundamental data. Note that our analysis may not factor in the latest price-sensitive company announcements or qualitative material. Simply Wall St has no position in any stocks mentioned.
About DSM:MARK
Masraf Al Rayan (Q.P.S.C.)
Engages in Islamic banking, financing, and investing activities in Qatar and internationally.
Acceptable track record second-rate dividend payer.
Market Insights

Community Narratives

