
Advertisement
- Poland
- /
- Entertainment
- /
- WSE:FOR
Is Forever Entertainment S.A.'s (WSE:FOR) Latest Stock Performance A Reflection Of Its Financial Health?
Forever Entertainment (WSE:FOR) has had a great run on the share market with its stock up by a significant 20% over the last month. Since the market usually pay for a company’s long-term fundamentals, we decided to study the company’s key performance indicators to see if they could be influencing the market. In this article, we decided to focus on Forever Entertainment's ROE.
Return on equity or ROE is an important factor to be considered by a shareholder because it tells them how effectively their capital is being reinvested. In other words, it is a profitability ratio which measures the rate of return on the capital provided by the company's shareholders.
See our latest analysis for Forever Entertainment
How Do You Calculate Return On Equity?
The formula for return on equity is:
Return on Equity = Net Profit (from continuing operations) ÷ Shareholders' Equity
So, based on the above formula, the ROE for Forever Entertainment is:
50% = zł16m ÷ zł31m (Based on the trailing twelve months to September 2020).
The 'return' is the income the business earned over the last year. So, this means that for every PLN1 of its shareholder's investments, the company generates a profit of PLN0.50.
Why Is ROE Important For Earnings Growth?
We have already established that ROE serves as an efficient profit-generating gauge for a company's future earnings. Depending on how much of these profits the company reinvests or "retains", and how effectively it does so, we are then able to assess a company’s earnings growth potential. Generally speaking, other things being equal, firms with a high return on equity and profit retention, have a higher growth rate than firms that don’t share these attributes.
Forever Entertainment's Earnings Growth And 50% ROE
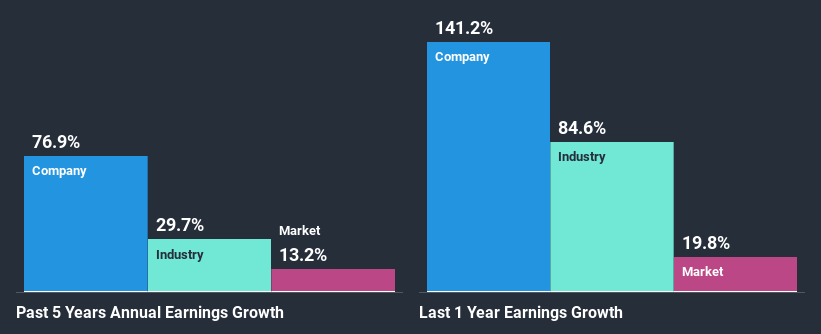
To begin with, Forever Entertainment has a pretty high ROE which is interesting. Secondly, even when compared to the industry average of 24% the company's ROE is quite impressive. As a result, Forever Entertainment's exceptional 77% net income growth seen over the past five years, doesn't come as a surprise.
Next, on comparing with the industry net income growth, we found that Forever Entertainment's growth is quite high when compared to the industry average growth of 30% in the same period, which is great to see.
Earnings growth is an important metric to consider when valuing a stock. What investors need to determine next is if the expected earnings growth, or the lack of it, is already built into the share price. By doing so, they will have an idea if the stock is headed into clear blue waters or if swampy waters await. If you're wondering about Forever Entertainment's's valuation, check out this gauge of its price-to-earnings ratio, as compared to its industry.
Is Forever Entertainment Efficiently Re-investing Its Profits?
Summary
Overall, we are quite pleased with Forever Entertainment's performance. Particularly, we like that the company is reinvesting heavily into its business, and at a high rate of return. Unsurprisingly, this has led to an impressive earnings growth. If the company continues to grow its earnings the way it has, that could have a positive impact on its share price given how earnings per share influence long-term share prices. Not to forget, share price outcomes are also dependent on the potential risks a company may face. So it is important for investors to be aware of the risks involved in the business. Our risks dashboard would have the 2 risks we have identified for Forever Entertainment.
If you decide to trade Forever Entertainment, use the lowest-cost* platform that is rated #1 Overall by Barron’s, Interactive Brokers. Trade stocks, options, futures, forex, bonds and funds on 135 markets, all from a single integrated account. Promoted
New: AI Stock Screener & Alerts
Our new AI Stock Screener scans the market every day to uncover opportunities.
• Dividend Powerhouses (3%+ Yield)
• Undervalued Small Caps with Insider Buying
• High growth Tech and AI Companies
Or build your own from over 50 metrics.
This article by Simply Wall St is general in nature. It does not constitute a recommendation to buy or sell any stock, and does not take account of your objectives, or your financial situation. We aim to bring you long-term focused analysis driven by fundamental data. Note that our analysis may not factor in the latest price-sensitive company announcements or qualitative material. Simply Wall St has no position in any stocks mentioned.
*Interactive Brokers Rated Lowest Cost Broker by StockBrokers.com Annual Online Review 2020
Have feedback on this article? Concerned about the content? Get in touch with us directly. Alternatively, email editorial-team (at) simplywallst.com.
About WSE:FOR
Forever Entertainment
Produces and publishes video games in Poland and internationally.
Flawless balance sheet with proven track record.
Market Insights

Advertisement
Community Narratives
A formidable player in AI and enterprise computing.
Fair Value US$210.00|3.9% overvalued
CO
Community Contributor
IREN's Bold Moves in Sustainable Bitcoin Mining & AI Data Centers
Fair Value US$72.52|4.1% undervalued
BL
Community Contributor
Cooling the Champions: The Aussie Tech Behind F1's Victories
Fair Value AU$12.40|39.4% undervalued
TR
Community Contributor