
Advertisement
- Poland
- /
- Metals and Mining
- /
- WSE:KTY
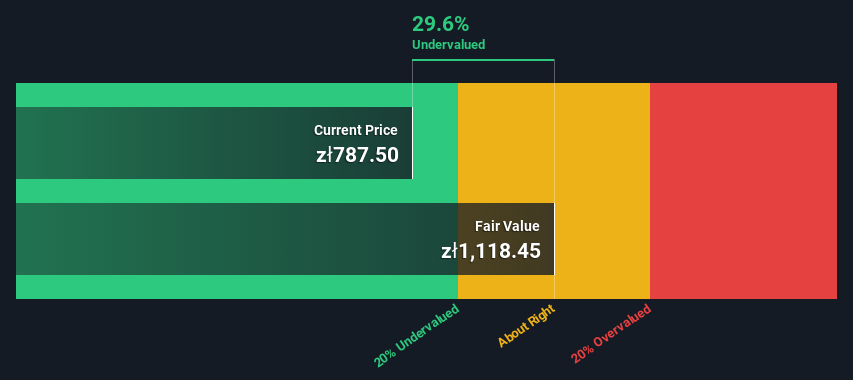
Is There An Opportunity With Grupa Kety S.A.'s (WSE:KTY) 30% Undervaluation?
Key Insights
- Using the 2 Stage Free Cash Flow to Equity, Grupa Kety fair value estimate is zł1,118
- Grupa Kety is estimated to be 30% undervalued based on current share price of zł788
- The zł825 analyst price target for KTY is 26% less than our estimate of fair value
In this article we are going to estimate the intrinsic value of Grupa Kety S.A. (WSE:KTY) by estimating the company's future cash flows and discounting them to their present value. Our analysis will employ the Discounted Cash Flow (DCF) model. Don't get put off by the jargon, the math behind it is actually quite straightforward.
We would caution that there are many ways of valuing a company and, like the DCF, each technique has advantages and disadvantages in certain scenarios. If you still have some burning questions about this type of valuation, take a look at the Simply Wall St analysis model.
See our latest analysis for Grupa Kety
Crunching The Numbers
We are going to use a two-stage DCF model, which, as the name states, takes into account two stages of growth. The first stage is generally a higher growth period which levels off heading towards the terminal value, captured in the second 'steady growth' period. In the first stage we need to estimate the cash flows to the business over the next ten years. Where possible we use analyst estimates, but when these aren't available we extrapolate the previous free cash flow (FCF) from the last estimate or reported value. We assume companies with shrinking free cash flow will slow their rate of shrinkage, and that companies with growing free cash flow will see their growth rate slow, over this period. We do this to reflect that growth tends to slow more in the early years than it does in later years.
Generally we assume that a dollar today is more valuable than a dollar in the future, so we discount the value of these future cash flows to their estimated value in today's dollars:
10-year free cash flow (FCF) forecast
| 2025 | 2026 | 2027 | 2028 | 2029 | 2030 | 2031 | 2032 | 2033 | 2034 | |
| Levered FCF (PLN, Millions) | zł585.8m | zł669.5m | zł713.0m | zł769.0m | zł811.5m | zł850.0m | zł889.0m | zł928.9m | zł970.0m | zł1.01b |
| Growth Rate Estimate Source | Analyst x4 | Analyst x4 | Analyst x2 | Analyst x2 | Analyst x2 | Est @ 4.74% | Est @ 4.59% | Est @ 4.49% | Est @ 4.42% | Est @ 4.37% |
| Present Value (PLN, Millions) Discounted @ 11% | zł530 | zł548 | zł528 | zł515 | zł492 | zł466 | zł441 | zł417 | zł394 | zł372 |
("Est" = FCF growth rate estimated by Simply Wall St)
Present Value of 10-year Cash Flow (PVCF) = zł4.7b
After calculating the present value of future cash flows in the initial 10-year period, we need to calculate the Terminal Value, which accounts for all future cash flows beyond the first stage. For a number of reasons a very conservative growth rate is used that cannot exceed that of a country's GDP growth. In this case we have used the 5-year average of the 10-year government bond yield (4.3%) to estimate future growth. In the same way as with the 10-year 'growth' period, we discount future cash flows to today's value, using a cost of equity of 11%.
Terminal Value (TV)= FCF2034 × (1 + g) ÷ (r – g) = zł1.0b× (1 + 4.3%) ÷ (11%– 4.3%) = zł17b
Present Value of Terminal Value (PVTV)= TV / (1 + r)10= zł17b÷ ( 1 + 11%)10= zł6.2b
The total value, or equity value, is then the sum of the present value of the future cash flows, which in this case is zł11b. The last step is to then divide the equity value by the number of shares outstanding. Compared to the current share price of zł788, the company appears a touch undervalued at a 30% discount to where the stock price trades currently. Remember though, that this is just an approximate valuation, and like any complex formula - garbage in, garbage out.
The Assumptions
The calculation above is very dependent on two assumptions. The first is the discount rate and the other is the cash flows. If you don't agree with these result, have a go at the calculation yourself and play with the assumptions. The DCF also does not consider the possible cyclicality of an industry, or a company's future capital requirements, so it does not give a full picture of a company's potential performance. Given that we are looking at Grupa Kety as potential shareholders, the cost of equity is used as the discount rate, rather than the cost of capital (or weighted average cost of capital, WACC) which accounts for debt. In this calculation we've used 11%, which is based on a levered beta of 1.149. Beta is a measure of a stock's volatility, compared to the market as a whole. We get our beta from the industry average beta of globally comparable companies, with an imposed limit between 0.8 and 2.0, which is a reasonable range for a stable business.
SWOT Analysis for Grupa Kety
Strength
- Debt is well covered by earnings and cashflows.
Weakness
- Earnings declined over the past year.
- Dividend is low compared to the top 25% of dividend payers in the Metals and Mining market.
Opportunity
- Annual revenue is forecast to grow faster than the Polish market.
- Trading below our estimate of fair value by more than 20%.
Threat
- Dividends are not covered by earnings and cashflows.
- Annual earnings are forecast to grow slower than the Polish market.
Looking Ahead:
Although the valuation of a company is important, it is only one of many factors that you need to assess for a company. It's not possible to obtain a foolproof valuation with a DCF model. Rather it should be seen as a guide to "what assumptions need to be true for this stock to be under/overvalued?" For example, changes in the company's cost of equity or the risk free rate can significantly impact the valuation. Why is the intrinsic value higher than the current share price? For Grupa Kety, we've put together three essential elements you should explore:
- Risks: For instance, we've identified 2 warning signs for Grupa Kety (1 shouldn't be ignored) you should be aware of.
- Future Earnings: How does KTY's growth rate compare to its peers and the wider market? Dig deeper into the analyst consensus number for the upcoming years by interacting with our free analyst growth expectation chart.
- Other Solid Businesses: Low debt, high returns on equity and good past performance are fundamental to a strong business. Why not explore our interactive list of stocks with solid business fundamentals to see if there are other companies you may not have considered!
PS. The Simply Wall St app conducts a discounted cash flow valuation for every stock on the WSE every day. If you want to find the calculation for other stocks just search here.
New: Manage All Your Stock Portfolios in One Place
We've created the ultimate portfolio companion for stock investors, and it's free.
• Connect an unlimited number of Portfolios and see your total in one currency
• Be alerted to new Warning Signs or Risks via email or mobile
• Track the Fair Value of your stocks
Have feedback on this article? Concerned about the content? Get in touch with us directly. Alternatively, email editorial-team (at) simplywallst.com.
This article by Simply Wall St is general in nature. We provide commentary based on historical data and analyst forecasts only using an unbiased methodology and our articles are not intended to be financial advice. It does not constitute a recommendation to buy or sell any stock, and does not take account of your objectives, or your financial situation. We aim to bring you long-term focused analysis driven by fundamental data. Note that our analysis may not factor in the latest price-sensitive company announcements or qualitative material. Simply Wall St has no position in any stocks mentioned.
About WSE:KTY
Grupa Kety
Through its subsidiaries, manufactures and sells aluminum profiles and components in Poland and internationally.
Adequate balance sheet and fair value.
Similar Companies
Market Insights

Advertisement
Community Narratives
A formidable player in AI and enterprise computing.
Fair Value US$210.00|12.2% overvalued
CO
Community Contributor
IREN's Bold Moves in Sustainable Bitcoin Mining & AI Data Centers
Fair Value US$72.52|17.1% undervalued
BL
Community Contributor
Cooling the Champions: The Aussie Tech Behind F1's Victories
Fair Value AU$12.40|38.7% undervalued
TR
Community Contributor