
Advertisement
Rafako S.A.'s (WSE:RFK) 34% Share Price Surge Not Quite Adding Up

Rafako S.A. (WSE:RFK) shareholders would be excited to see that the share price has had a great month, posting a 34% gain and recovering from prior weakness. Unfortunately, the gains of the last month did little to right the losses of the last year with the stock still down 32% over that time.
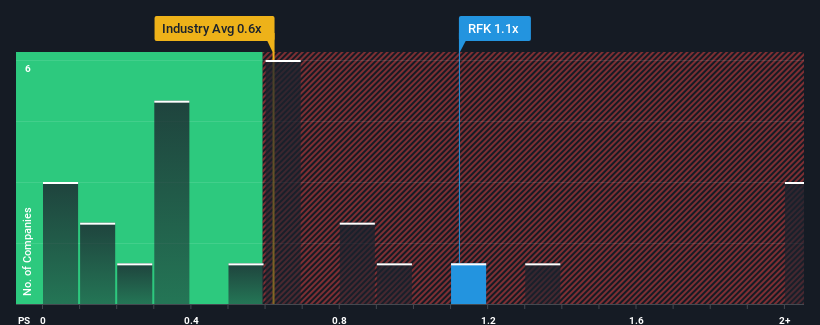
After such a large jump in price, you could be forgiven for thinking Rafako is a stock not worth researching with a price-to-sales ratios (or "P/S") of 1.1x, considering almost half the companies in Poland's Machinery industry have P/S ratios below 0.6x. However, the P/S might be high for a reason and it requires further investigation to determine if it's justified.
View our latest analysis for Rafako
How Rafako Has Been Performing
As an illustration, revenue has deteriorated at Rafako over the last year, which is not ideal at all. One possibility is that the P/S is high because investors think the company will still do enough to outperform the broader industry in the near future. However, if this isn't the case, investors might get caught out paying too much for the stock.
Although there are no analyst estimates available for Rafako, take a look at this free data-rich visualisation to see how the company stacks up on earnings, revenue and cash flow.What Are Revenue Growth Metrics Telling Us About The High P/S?
Rafako's P/S ratio would be typical for a company that's expected to deliver solid growth, and importantly, perform better than the industry.
Taking a look back first, the company's revenue growth last year wasn't something to get excited about as it posted a disappointing decline of 60%. The last three years don't look nice either as the company has shrunk revenue by 87% in aggregate. So unfortunately, we have to acknowledge that the company has not done a great job of growing revenue over that time.
Comparing that to the industry, which is predicted to deliver 23% growth in the next 12 months, the company's downward momentum based on recent medium-term revenue results is a sobering picture.
In light of this, it's alarming that Rafako's P/S sits above the majority of other companies. Apparently many investors in the company are way more bullish than recent times would indicate and aren't willing to let go of their stock at any price. Only the boldest would assume these prices are sustainable as a continuation of recent revenue trends is likely to weigh heavily on the share price eventually.
What We Can Learn From Rafako's P/S?
Rafako's P/S is on the rise since its shares have risen strongly. While the price-to-sales ratio shouldn't be the defining factor in whether you buy a stock or not, it's quite a capable barometer of revenue expectations.
We've established that Rafako currently trades on a much higher than expected P/S since its recent revenues have been in decline over the medium-term. When we see revenue heading backwards and underperforming the industry forecasts, we feel the possibility of the share price declining is very real, bringing the P/S back into the realm of reasonability. Unless the the circumstances surrounding the recent medium-term improve, it wouldn't be wrong to expect a a difficult period ahead for the company's shareholders.
It is also worth noting that we have found 4 warning signs for Rafako (3 can't be ignored!) that you need to take into consideration.
It's important to make sure you look for a great company, not just the first idea you come across. So if growing profitability aligns with your idea of a great company, take a peek at this free list of interesting companies with strong recent earnings growth (and a low P/E).
New: AI Stock Screener & Alerts
Our new AI Stock Screener scans the market every day to uncover opportunities.
• Dividend Powerhouses (3%+ Yield)
• Undervalued Small Caps with Insider Buying
• High growth Tech and AI Companies
Or build your own from over 50 metrics.
Have feedback on this article? Concerned about the content? Get in touch with us directly. Alternatively, email editorial-team (at) simplywallst.com.
This article by Simply Wall St is general in nature. We provide commentary based on historical data and analyst forecasts only using an unbiased methodology and our articles are not intended to be financial advice. It does not constitute a recommendation to buy or sell any stock, and does not take account of your objectives, or your financial situation. We aim to bring you long-term focused analysis driven by fundamental data. Note that our analysis may not factor in the latest price-sensitive company announcements or qualitative material. Simply Wall St has no position in any stocks mentioned.
About WSE:RFK
Rafako
Engages in the engineering business to the energy sector, and oil and gas sectors in Poland and internationally.
Medium-low with weak fundamentals.
Similar Companies
Market Insights

Advertisement
Community Narratives
Scaling up in building materials with smart M&A and growing profitability
Fair Value US$2.77|24.5% undervalued
CM
Community Contributor
Hims: The Platform Powering Personalised Healthcare
Fair Value US$114.01|45.3% undervalued
BL
Community Contributor
Undervalued lottery company with strong fundamentals
Fair Value AU$15.00|33.9% undervalued
RO
Community Contributor
Proximus, transferring money from the impatient to the patient investor
Fair Value €16.62|56.1% undervalued
AX
Community Contributor