
Advertisement
- New Zealand
- /
- Logistics
- /
- NZSE:MFT
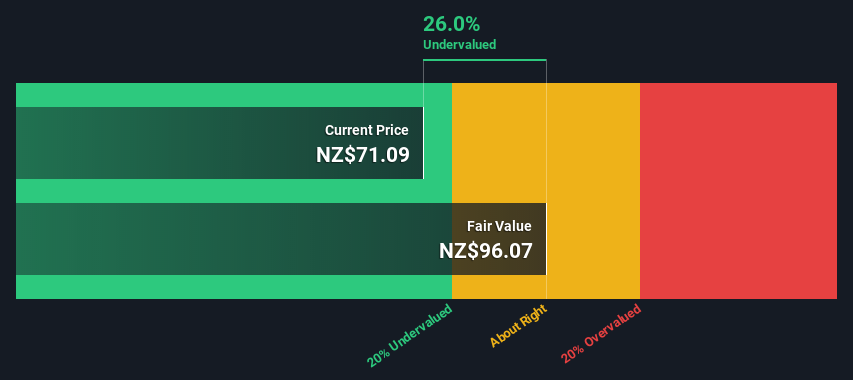
An Intrinsic Calculation For Mainfreight Limited (NZSE:MFT) Suggests It's 26% Undervalued
Key Insights
- Mainfreight's estimated fair value is NZ$96.04 based on 2 Stage Free Cash Flow to Equity
- Mainfreight is estimated to be 26% undervalued based on current share price of NZ$71.09
- Analyst price target for MFT is NZ$91.51 which is 4.7% below our fair value estimate
Today we will run through one way of estimating the intrinsic value of Mainfreight Limited (NZSE:MFT) by taking the expected future cash flows and discounting them to their present value. We will take advantage of the Discounted Cash Flow (DCF) model for this purpose. It may sound complicated, but actually it is quite simple!
We generally believe that a company's value is the present value of all of the cash it will generate in the future. However, a DCF is just one valuation metric among many, and it is not without flaws. For those who are keen learners of equity analysis, the Simply Wall St analysis model here may be something of interest to you.
View our latest analysis for Mainfreight
What's The Estimated Valuation?
We use what is known as a 2-stage model, which simply means we have two different periods of growth rates for the company's cash flows. Generally the first stage is higher growth, and the second stage is a lower growth phase. To begin with, we have to get estimates of the next ten years of cash flows. Seeing as no analyst estimates of free cash flow are available to us, we have extrapolate the previous free cash flow (FCF) from the company's last reported value. We assume companies with shrinking free cash flow will slow their rate of shrinkage, and that companies with growing free cash flow will see their growth rate slow, over this period. We do this to reflect that growth tends to slow more in the early years than it does in later years.
A DCF is all about the idea that a dollar in the future is less valuable than a dollar today, so we need to discount the sum of these future cash flows to arrive at a present value estimate:
10-year free cash flow (FCF) estimate
| 2023 | 2024 | 2025 | 2026 | 2027 | 2028 | 2029 | 2030 | 2031 | 2032 | |
| Levered FCF (NZ$, Millions) | NZ$434.7m | NZ$494.4m | NZ$545.2m | NZ$587.9m | NZ$623.9m | NZ$654.8m | NZ$681.7m | NZ$705.8m | NZ$727.8m | NZ$748.5m |
| Growth Rate Estimate Source | Est @ 18.69% | Est @ 13.73% | Est @ 10.26% | Est @ 7.83% | Est @ 6.14% | Est @ 4.95% | Est @ 4.11% | Est @ 3.53% | Est @ 3.12% | Est @ 2.84% |
| Present Value (NZ$, Millions) Discounted @ 8.2% | NZ$402 | NZ$422 | NZ$430 | NZ$428 | NZ$420 | NZ$407 | NZ$392 | NZ$374 | NZ$357 | NZ$339 |
("Est" = FCF growth rate estimated by Simply Wall St)
Present Value of 10-year Cash Flow (PVCF) = NZ$4.0b
After calculating the present value of future cash flows in the initial 10-year period, we need to calculate the Terminal Value, which accounts for all future cash flows beyond the first stage. The Gordon Growth formula is used to calculate Terminal Value at a future annual growth rate equal to the 5-year average of the 10-year government bond yield of 2.2%. We discount the terminal cash flows to today's value at a cost of equity of 8.2%.
Terminal Value (TV)= FCF2032 × (1 + g) ÷ (r – g) = NZ$748m× (1 + 2.2%) ÷ (8.2%– 2.2%) = NZ$13b
Present Value of Terminal Value (PVTV)= TV / (1 + r)10= NZ$13b÷ ( 1 + 8.2%)10= NZ$5.7b
The total value is the sum of cash flows for the next ten years plus the discounted terminal value, which results in the Total Equity Value, which in this case is NZ$9.7b. To get the intrinsic value per share, we divide this by the total number of shares outstanding. Compared to the current share price of NZ$71.1, the company appears a touch undervalued at a 26% discount to where the stock price trades currently. Remember though, that this is just an approximate valuation, and like any complex formula - garbage in, garbage out.
Important Assumptions
The calculation above is very dependent on two assumptions. The first is the discount rate and the other is the cash flows. Part of investing is coming up with your own evaluation of a company's future performance, so try the calculation yourself and check your own assumptions. The DCF also does not consider the possible cyclicality of an industry, or a company's future capital requirements, so it does not give a full picture of a company's potential performance. Given that we are looking at Mainfreight as potential shareholders, the cost of equity is used as the discount rate, rather than the cost of capital (or weighted average cost of capital, WACC) which accounts for debt. In this calculation we've used 8.2%, which is based on a levered beta of 1.023. Beta is a measure of a stock's volatility, compared to the market as a whole. We get our beta from the industry average beta of globally comparable companies, with an imposed limit between 0.8 and 2.0, which is a reasonable range for a stable business.
SWOT Analysis for Mainfreight
Strength
- Earnings growth over the past year exceeded its 5-year average.
- Debt is not viewed as a risk.
- Dividends are covered by earnings and cash flows.
Weakness
- Earnings growth over the past year underperformed the Logistics industry.
- Dividend is low compared to the top 25% of dividend payers in the Logistics market.
Opportunity
- Good value based on P/E ratio and estimated fair value.
Threat
- Annual earnings are forecast to decline for the next 4 years.
Moving On:
Whilst important, the DCF calculation ideally won't be the sole piece of analysis you scrutinize for a company. The DCF model is not a perfect stock valuation tool. Rather it should be seen as a guide to "what assumptions need to be true for this stock to be under/overvalued?" If a company grows at a different rate, or if its cost of equity or risk free rate changes sharply, the output can look very different. Can we work out why the company is trading at a discount to intrinsic value? For Mainfreight, we've put together three additional items you should look at:
- Risks: Consider for instance, the ever-present spectre of investment risk. We've identified 2 warning signs with Mainfreight (at least 1 which is significant) , and understanding these should be part of your investment process.
- Future Earnings: How does MFT's growth rate compare to its peers and the wider market? Dig deeper into the analyst consensus number for the upcoming years by interacting with our free analyst growth expectation chart.
- Other High Quality Alternatives: Do you like a good all-rounder? Explore our interactive list of high quality stocks to get an idea of what else is out there you may be missing!
PS. Simply Wall St updates its DCF calculation for every New Zealander stock every day, so if you want to find the intrinsic value of any other stock just search here.
New: Manage All Your Stock Portfolios in One Place
We've created the ultimate portfolio companion for stock investors, and it's free.
• Connect an unlimited number of Portfolios and see your total in one currency
• Be alerted to new Warning Signs or Risks via email or mobile
• Track the Fair Value of your stocks
Have feedback on this article? Concerned about the content? Get in touch with us directly. Alternatively, email editorial-team (at) simplywallst.com.
This article by Simply Wall St is general in nature. We provide commentary based on historical data and analyst forecasts only using an unbiased methodology and our articles are not intended to be financial advice. It does not constitute a recommendation to buy or sell any stock, and does not take account of your objectives, or your financial situation. We aim to bring you long-term focused analysis driven by fundamental data. Note that our analysis may not factor in the latest price-sensitive company announcements or qualitative material. Simply Wall St has no position in any stocks mentioned.
About NZSE:MFT
Mainfreight
Provides supply chain logistics services in New Zealand, Australia, the Americas, Europe, and Asia.
Solid track record with excellent balance sheet and pays a dividend.
Similar Companies
Market Insights

Advertisement
Community Narratives
Quality at a Premium. A time to watch, not to buy?
Fair Value US$154.56|29.9% undervalued
DA
Community Contributor
GRAB: The Super-App at the Heart of Southeast Asia’s Digital Boom
Fair Value US$8.20|22.9% undervalued
BL
Community Contributor
Verve Group to Surge with 51.61% Revenue Growth
Fair Value €6.00|64.1% undervalued
ME
Community Contributor