- Japan
- /
- Hospitality
- /
- TSE:3397
3 Stocks That May Be Undervalued In February 2025

Reviewed by Simply Wall St

In February 2025, global markets are grappling with geopolitical tensions and economic uncertainties, as highlighted by declining major U.S. indexes and concerns over consumer spending. Amid these challenges, investors are increasingly seeking opportunities in undervalued stocks that may offer potential resilience and growth despite the broader market volatility.
Top 10 Undervalued Stocks Based On Cash Flows
| Name | Current Price | Fair Value (Est) | Discount (Est) |
| Ningbo Sanxing Medical ElectricLtd (SHSE:601567) | CN¥26.29 | CN¥52.35 | 49.8% |
| MINISO Group Holding (NYSE:MNSO) | US$20.68 | US$41.04 | 49.6% |
| KG Mobilians (KOSDAQ:A046440) | ₩4515.00 | ₩8963.80 | 49.6% |
| Vimi Fasteners (BIT:VIM) | €0.96 | €1.91 | 49.8% |
| Power Wind Health Industry (TWSE:8462) | NT$113.00 | NT$225.71 | 49.9% |
| CD Projekt (WSE:CDR) | PLN220.70 | PLN441.19 | 50% |
| Vestas Wind Systems (CPSE:VWS) | DKK102.40 | DKK204.54 | 49.9% |
| Thunderbird Entertainment Group (TSXV:TBRD) | CA$1.69 | CA$3.36 | 49.6% |
| Sung Kwang BendLtd (KOSDAQ:A014620) | ₩27950.00 | ₩55879.35 | 50% |
| Sandfire Resources (ASX:SFR) | A$10.58 | A$21.10 | 49.9% |
Let's uncover some gems from our specialized screener.
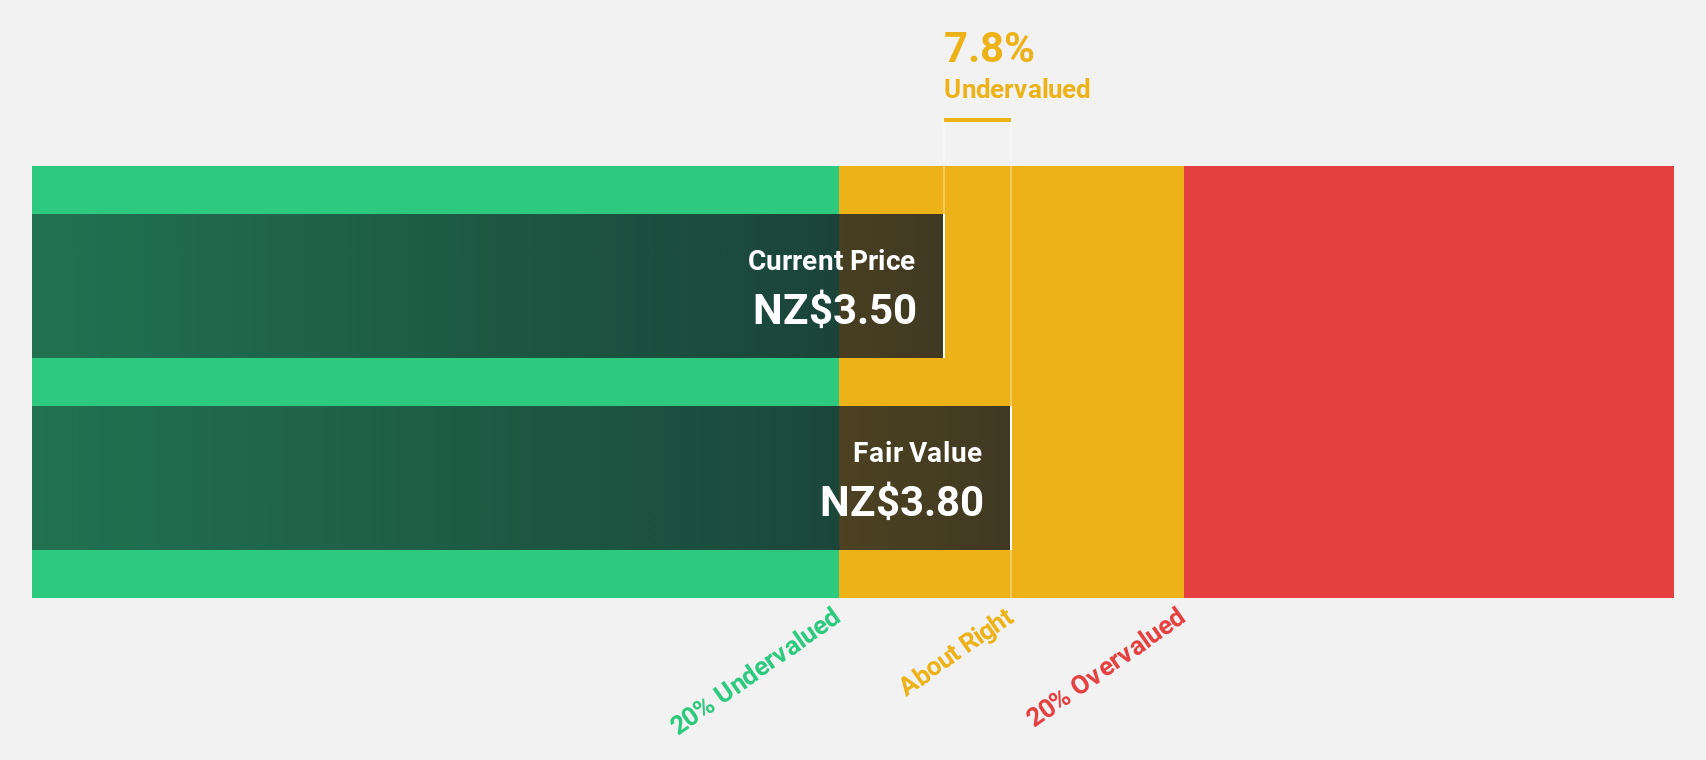
Vista Group International (NZSE:VGL)
Overview: Vista Group International Limited offers software and data analytics solutions to the global film industry, with a market cap of NZ$772.45 million.
Operations: Vista Group International Limited generates revenue through its software and data analytics solutions tailored for the global film industry.
Estimated Discount To Fair Value: 48.8%
Vista Group International is trading at NZ$3.28, significantly below its estimated fair value of NZ$6.41, indicating it is undervalued based on discounted cash flow analysis. The company’s revenue is projected to grow at 12.3% annually, outpacing the broader New Zealand market growth rate of 4.8%. While Vista's Return on Equity is expected to remain modest at 12% in three years, its earnings are anticipated to grow substantially by 47.67% annually as it becomes profitable within this period.
- Our growth report here indicates Vista Group International may be poised for an improving outlook.
- Take a closer look at Vista Group International's balance sheet health here in our report.
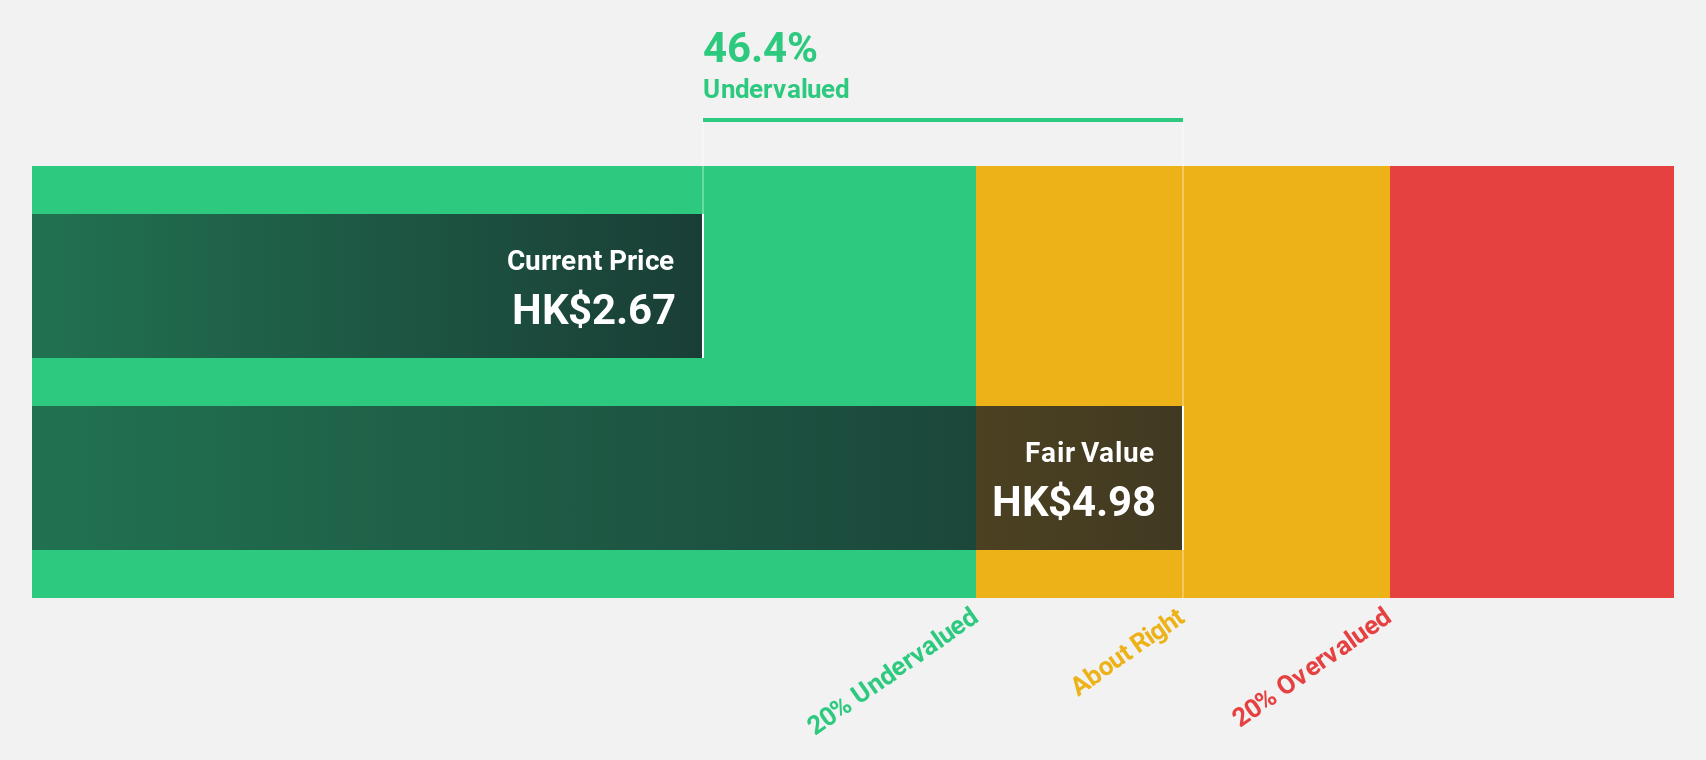
Best Pacific International Holdings (SEHK:2111)
Overview: Best Pacific International Holdings Limited, with a market cap of HK$3.07 billion, operates through its subsidiaries to manufacture, trade in, and sell elastic fabric, elastic webbing, and lace.
Operations: The company's revenue segments include the manufacturing and trading of elastic webbing, generating HK$915.53 million, and the manufacturing and trading of elastic fabric and lace, contributing HK$3.76 billion.
Estimated Discount To Fair Value: 43.3%
Best Pacific International Holdings is trading at HK$3.01, well below its estimated fair value of HK$5.31, highlighting its undervaluation based on discounted cash flow analysis. The company's earnings are projected to grow significantly at 21.4% annually, surpassing the Hong Kong market's growth rate of 11.6%. However, despite robust earnings growth and good relative value compared to peers, the company faces a low forecasted Return on Equity of 19.6% in three years and an unstable dividend history.
- In light of our recent growth report, it seems possible that Best Pacific International Holdings' financial performance will exceed current levels.
- Dive into the specifics of Best Pacific International Holdings here with our thorough financial health report.
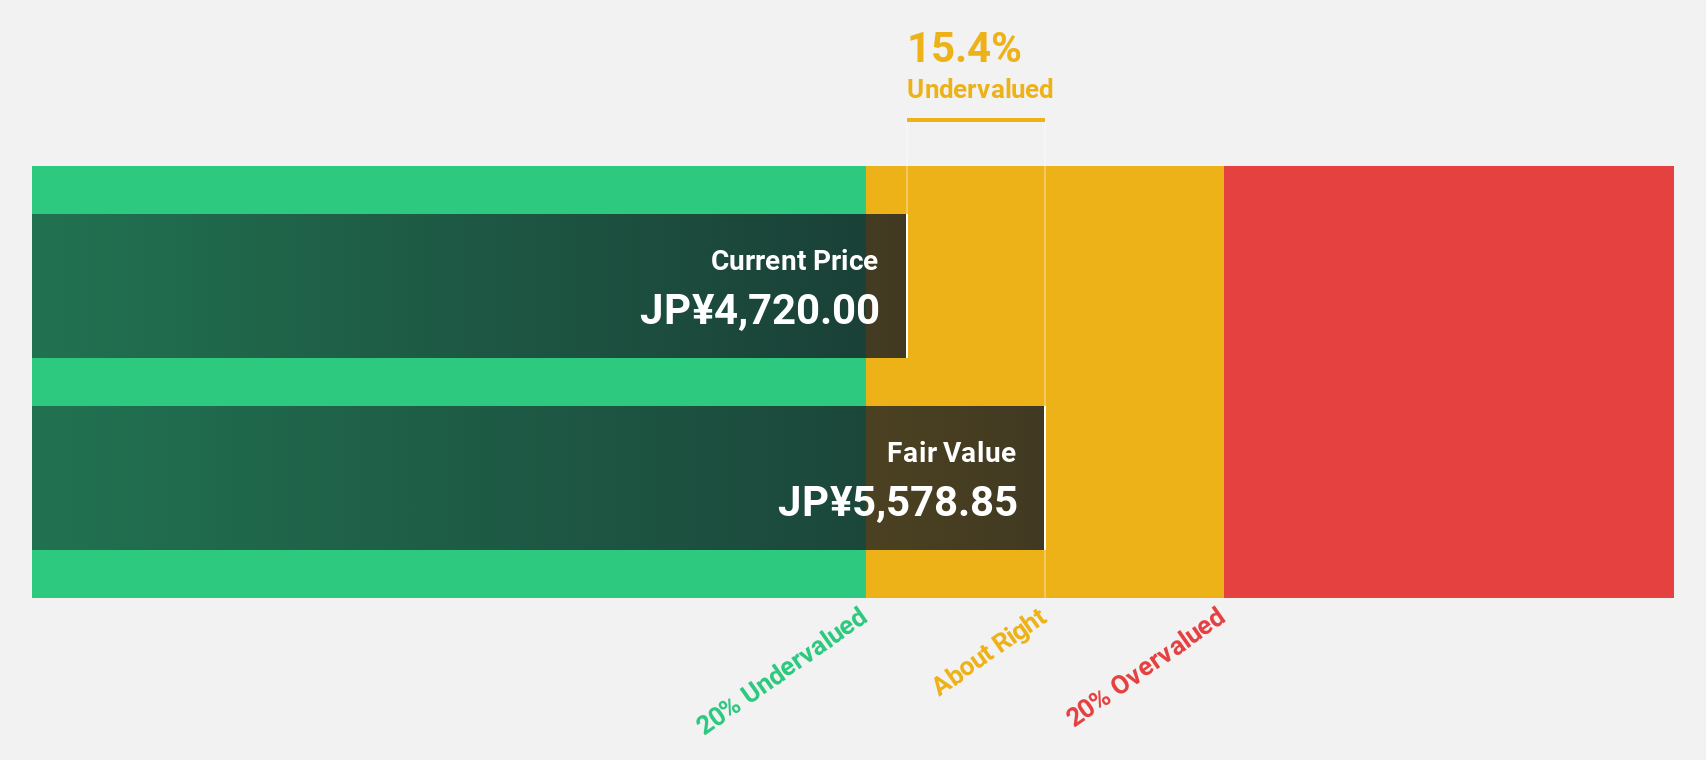
TORIDOLL Holdings (TSE:3397)
Overview: TORIDOLL Holdings Corporation operates and manages restaurants both in Japan and internationally, with a market cap of ¥332.13 billion.
Operations: The company's revenue is derived from three main segments: Marugame Seimen, contributing ¥125.38 billion; Overseas Business, generating ¥102.43 billion; and Other Domestic operations, adding ¥33.59 billion.
Estimated Discount To Fair Value: 30.7%
TORIDOLL Holdings is trading at ¥3816, significantly below its estimated fair value of ¥5510.24, indicating undervaluation based on cash flow analysis. The company's earnings are forecasted to grow substantially at 37.8% annually, outpacing the Japanese market's growth rate. However, despite strong earnings and revenue growth projections, its Return on Equity is expected to remain low at 11.1% in three years due to large one-off items impacting financial results.
- Our comprehensive growth report raises the possibility that TORIDOLL Holdings is poised for substantial financial growth.
- Unlock comprehensive insights into our analysis of TORIDOLL Holdings stock in this financial health report.
Summing It All Up
- Access the full spectrum of 925 Undervalued Stocks Based On Cash Flows by clicking on this link.
- Already own these companies? Bring clarity to your investment decisions by linking up your portfolio with Simply Wall St, where you can monitor all the vital signs of your stocks effortlessly.
- Enhance your investing ability with the Simply Wall St app and enjoy free access to essential market intelligence spanning every continent.
Curious About Other Options?
- Explore high-performing small cap companies that haven't yet garnered significant analyst attention.
- Diversify your portfolio with solid dividend payers offering reliable income streams to weather potential market turbulence.
- Fuel your portfolio with companies showing strong growth potential, backed by optimistic outlooks both from analysts and management.
This article by Simply Wall St is general in nature. We provide commentary based on historical data and analyst forecasts only using an unbiased methodology and our articles are not intended to be financial advice. It does not constitute a recommendation to buy or sell any stock, and does not take account of your objectives, or your financial situation. We aim to bring you long-term focused analysis driven by fundamental data. Note that our analysis may not factor in the latest price-sensitive company announcements or qualitative material. Simply Wall St has no position in any stocks mentioned.
Valuation is complex, but we're here to simplify it.
Discover if TORIDOLL Holdings might be undervalued or overvalued with our detailed analysis, featuring fair value estimates, potential risks, dividends, insider trades, and its financial condition.
Access Free AnalysisHave feedback on this article? Concerned about the content? Get in touch with us directly. Alternatively, email editorial-team@simplywallst.com
About TSE:3397
TORIDOLL Holdings
Through its subsidiaries, operates and manages restaurants in Japan and internationally.
Excellent balance sheet with reasonable growth potential.
Similar Companies
Market Insights

Community Narratives
