

We can readily understand why investors are attracted to unprofitable companies. For example, although software-as-a-service business Salesforce.com lost money for years while it grew recurring revenue, if you held shares since 2005, you'd have done very well indeed. But the harsh reality is that very many loss making companies burn through all their cash and go bankrupt.
Given this risk, we thought we'd take a look at whether Pacific Edge (NZSE:PEB) shareholders should be worried about its cash burn. In this report, we will consider the company's annual negative free cash flow, henceforth referring to it as the 'cash burn'. Let's start with an examination of the business' cash, relative to its cash burn.
Check out our latest analysis for Pacific Edge
Does Pacific Edge Have A Long Cash Runway?
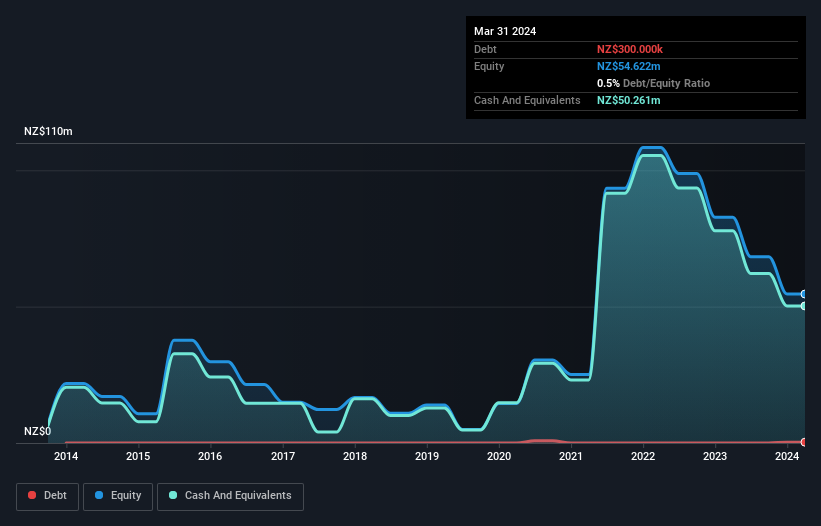
A company's cash runway is the amount of time it would take to burn through its cash reserves at its current cash burn rate. As at March 2024, Pacific Edge had cash of NZ$50m and such minimal debt that we can ignore it for the purposes of this analysis. Importantly, its cash burn was NZ$27m over the trailing twelve months. So it had a cash runway of approximately 22 months from March 2024. That's not too bad, but it's fair to say the end of the cash runway is in sight, unless cash burn reduces drastically. You can see how its cash balance has changed over time in the image below.
How Well Is Pacific Edge Growing?
Pacific Edge reduced its cash burn by 4.8% during the last year, which points to some degree of discipline. And considering that its operating revenue gained 22% during that period, that's great to see. Considering the factors above, the company doesn’t fare badly when it comes to assessing how it is changing over time. Clearly, however, the crucial factor is whether the company will grow its business going forward. So you might want to take a peek at how much the company is expected to grow in the next few years.
How Hard Would It Be For Pacific Edge To Raise More Cash For Growth?
Pacific Edge seems to be in a fairly good position, in terms of cash burn, but we still think it's worthwhile considering how easily it could raise more money if it wanted to. Companies can raise capital through either debt or equity. One of the main advantages held by publicly listed companies is that they can sell shares to investors to raise cash and fund growth. We can compare a company's cash burn to its market capitalisation to get a sense for how many new shares a company would have to issue to fund one year's operations.
Since it has a market capitalisation of NZ$80m, Pacific Edge's NZ$27m in cash burn equates to about 34% of its market value. That's not insignificant, and if the company had to sell enough shares to fund another year's growth at the current share price, you'd likely witness fairly costly dilution.
How Risky Is Pacific Edge's Cash Burn Situation?
Even though its cash burn relative to its market cap makes us a little nervous, we are compelled to mention that we thought Pacific Edge's revenue growth was relatively promising. Even though we don't think it has a problem with its cash burn, the analysis we've done in this article does suggest that shareholders should give some careful thought to the potential cost of raising more money in the future. Its important for readers to be cognizant of the risks that can affect the company's operations, and we've picked out 3 warning signs for Pacific Edge that investors should know when investing in the stock.
Of course, you might find a fantastic investment by looking elsewhere. So take a peek at this free list of companies with significant insider holdings, and this list of stocks growth stocks (according to analyst forecasts)
New: Manage All Your Stock Portfolios in One Place
We've created the ultimate portfolio companion for stock investors, and it's free.
• Connect an unlimited number of Portfolios and see your total in one currency
• Be alerted to new Warning Signs or Risks via email or mobile
• Track the Fair Value of your stocks
Have feedback on this article? Concerned about the content? Get in touch with us directly. Alternatively, email editorial-team (at) simplywallst.com.
This article by Simply Wall St is general in nature. We provide commentary based on historical data and analyst forecasts only using an unbiased methodology and our articles are not intended to be financial advice. It does not constitute a recommendation to buy or sell any stock, and does not take account of your objectives, or your financial situation. We aim to bring you long-term focused analysis driven by fundamental data. Note that our analysis may not factor in the latest price-sensitive company announcements or qualitative material. Simply Wall St has no position in any stocks mentioned.
About NZSE:PEB
Pacific Edge
A cancer diagnostics company, researches, develops, and commercializes diagnostic and prognostic tools for the early detection and management of cancers in New Zealand, the United States, and internationally.
Excellent balance sheet low.
Similar Companies
Market Insights

Community Narratives


