
Advertisement
- New Zealand
- /
- Healthcare Services
- /
- NZSE:EBO
EBOS Group First Half 2025 Earnings: EPS: AU$0.57 (vs AU$0.71 in 1H 2024)

EBOS Group (NZSE:EBO) First Half 2025 Results
Key Financial Results
- Revenue: AU$5.99b (down 9.0% from 1H 2024).
- Net income: AU$110.5m (down 19% from 1H 2024).
- Profit margin: 1.8% (down from 2.1% in 1H 2024). The decrease in margin was driven by lower revenue.
- EPS: AU$0.57 (down from AU$0.71 in 1H 2024).
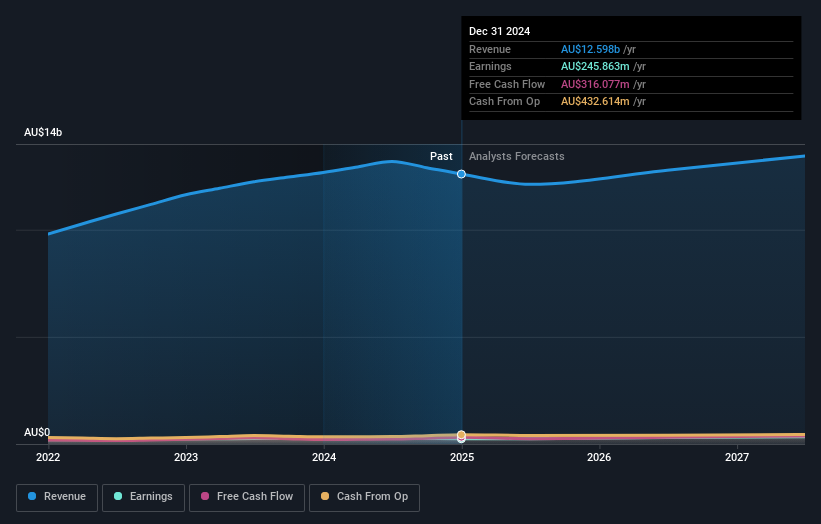
All figures shown in the chart above are for the trailing 12 month (TTM) period
EBOS Group Earnings Insights
Looking ahead, revenue is forecast to grow 3.8% p.a. on average during the next 3 years, compared to a 5.6% growth forecast for the Healthcare industry in New Zealand.
Performance of the New Zealander Healthcare industry.
The company's shares are down 6.9% from a week ago.
Risk Analysis
Before we wrap up, we've discovered 1 warning sign for EBOS Group that you should be aware of.
Valuation is complex, but we're here to simplify it.
Discover if EBOS Group might be undervalued or overvalued with our detailed analysis, featuring fair value estimates, potential risks, dividends, insider trades, and its financial condition.
Access Free AnalysisHave feedback on this article? Concerned about the content? Get in touch with us directly. Alternatively, email editorial-team (at) simplywallst.com.
This article by Simply Wall St is general in nature. We provide commentary based on historical data and analyst forecasts only using an unbiased methodology and our articles are not intended to be financial advice. It does not constitute a recommendation to buy or sell any stock, and does not take account of your objectives, or your financial situation. We aim to bring you long-term focused analysis driven by fundamental data. Note that our analysis may not factor in the latest price-sensitive company announcements or qualitative material. Simply Wall St has no position in any stocks mentioned.
About NZSE:EBO
EBOS Group
Engages in the marketing, wholesale, and distribution of healthcare, medical, pharmaceutical, and animal care products in Australia, Southeast Asia, and New Zealand.
Adequate balance sheet average dividend payer.
Market Insights

Advertisement
Community Narratives
RIO is poised to weather a depressed iron ore environment, but commodity diversification comes with lower margins
Fair Value AU$110.51|4.0% overvalued
DU
Community Contributor
The demand for personalized medicine will keep Thermo Fisher Scientific thriving
Fair Value US$540.27|21.5% undervalued
UN
Community Contributor
Silver Play by A Family with 10x Potential
Fair Value UK£24.00|88.8% undervalued
RO
Community Contributor