- New Zealand
- /
- Building
- /
- NZSE:FBU
Fletcher Building Limited (NZSE:FBU) May Have Run Too Fast Too Soon With Recent 27% Price Plummet
The Fletcher Building Limited (NZSE:FBU) share price has fared very poorly over the last month, falling by a substantial 27%. The drop over the last 30 days has capped off a tough year for shareholders, with the share price down 42% in that time.
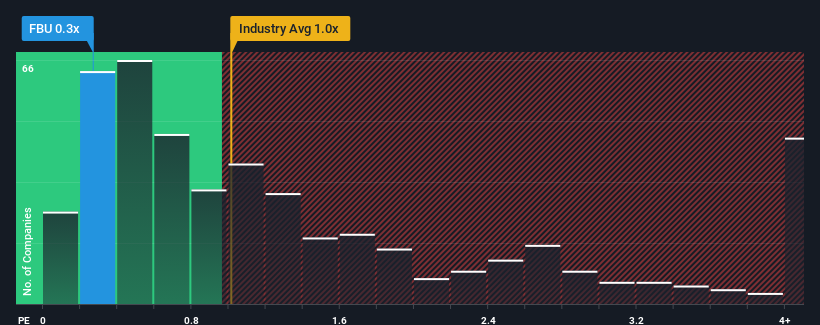
In spite of the heavy fall in price, it's still not a stretch to say that Fletcher Building's price-to-sales (or "P/S") ratio of 0.3x right now seems quite "middle-of-the-road" compared to the Building industry in New Zealand, seeing as it matches the P/S ratio of the wider industry. However, investors might be overlooking a clear opportunity or potential setback if there is no rational basis for the P/S.
Check out our latest analysis for Fletcher Building

How Has Fletcher Building Performed Recently?
Fletcher Building's negative revenue growth of late has neither been better nor worse than most other companies. The P/S ratio is probably moderate because investors think the company's revenue trend will continue to follow the rest of the industry. If you still like the company, you'd want its revenue trajectory to turn around before making any decisions. At the very least, you'd be hoping that revenue doesn't accelerate downwards if your plan is to pick up some stock while it's not in favour.
Keen to find out how analysts think Fletcher Building's future stacks up against the industry? In that case, our free report is a great place to start.How Is Fletcher Building's Revenue Growth Trending?
In order to justify its P/S ratio, Fletcher Building would need to produce growth that's similar to the industry.
In reviewing the last year of financials, we were disheartened to see the company's revenues fell to the tune of 3.3%. Regardless, revenue has managed to lift by a handy 15% in aggregate from three years ago, thanks to the earlier period of growth. Accordingly, while they would have preferred to keep the run going, shareholders would be roughly satisfied with the medium-term rates of revenue growth.
Shifting to the future, estimates from the analysts covering the company suggest revenue growth is heading into negative territory, declining 0.3% per annum over the next three years. That's not great when the rest of the industry is expected to grow by 5.7% per year.
With this in consideration, we think it doesn't make sense that Fletcher Building's P/S is closely matching its industry peers. It seems most investors are hoping for a turnaround in the company's business prospects, but the analyst cohort is not so confident this will happen. Only the boldest would assume these prices are sustainable as these declining revenues are likely to weigh on the share price eventually.
What We Can Learn From Fletcher Building's P/S?
With its share price dropping off a cliff, the P/S for Fletcher Building looks to be in line with the rest of the Building industry. While the price-to-sales ratio shouldn't be the defining factor in whether you buy a stock or not, it's quite a capable barometer of revenue expectations.
Our check of Fletcher Building's analyst forecasts revealed that its outlook for shrinking revenue isn't bringing down its P/S as much as we would have predicted. When we see a gloomy outlook like this, our immediate thoughts are that the share price is at risk of declining, negatively impacting P/S. If we consider the revenue outlook, the P/S seems to indicate that potential investors may be paying a premium for the stock.
Before you take the next step, you should know about the 3 warning signs for Fletcher Building that we have uncovered.
Of course, profitable companies with a history of great earnings growth are generally safer bets. So you may wish to see this free collection of other companies that have reasonable P/E ratios and have grown earnings strongly.
New: AI Stock Screener & Alerts
Our new AI Stock Screener scans the market every day to uncover opportunities.
• Dividend Powerhouses (3%+ Yield)
• Undervalued Small Caps with Insider Buying
• High growth Tech and AI Companies
Or build your own from over 50 metrics.
Have feedback on this article? Concerned about the content? Get in touch with us directly. Alternatively, email editorial-team (at) simplywallst.com.
This article by Simply Wall St is general in nature. We provide commentary based on historical data and analyst forecasts only using an unbiased methodology and our articles are not intended to be financial advice. It does not constitute a recommendation to buy or sell any stock, and does not take account of your objectives, or your financial situation. We aim to bring you long-term focused analysis driven by fundamental data. Note that our analysis may not factor in the latest price-sensitive company announcements or qualitative material. Simply Wall St has no position in any stocks mentioned.
About NZSE:FBU
Fletcher Building
Manufactures and distributes building products in New Zealand, Australia, and internationally.
Undervalued with reasonable growth potential.
Similar Companies
Market Insights
Community Narratives


