Advertisement
- Sweden
- /
- Industrials
- /
- OM:KARNEL B
Exploring Europe's Undiscovered Gems In May 2025

Simply Wall St
Reviewed by Simply Wall St

In the midst of heightened trade tensions and economic uncertainty, the European market has faced a challenging landscape, with key indices like the STOXX Europe 600 Index snapping a streak of gains due to tariff threats from the U.S. Despite these headwinds, opportunities remain for discerning investors who can identify small-cap stocks that are well-positioned to thrive in such volatile conditions.
Top 10 Undiscovered Gems With Strong Fundamentals In Europe
| Name | Debt To Equity | Revenue Growth | Earnings Growth | Health Rating |
|---|---|---|---|---|
| AB Traction | NA | 5.39% | 5.24% | ★★★★★★ |
| Linc | NA | 101.28% | 29.81% | ★★★★★★ |
| La Forestière Equatoriale | NA | -65.30% | 37.55% | ★★★★★★ |
| Intellego Technologies | 11.59% | 68.05% | 72.76% | ★★★★★★ |
| Caisse Regionale de Credit Agricole Mutuel Toulouse 31 | 19.46% | 0.47% | 7.14% | ★★★★★☆ |
| Decora | 18.47% | 11.59% | 10.86% | ★★★★★☆ |
| Viohalco | 91.31% | 12.25% | 17.37% | ★★★★☆☆ |
| Inversiones Doalca SOCIMI | 15.57% | 6.53% | 7.16% | ★★★★☆☆ |
| Castellana Properties Socimi | 53.49% | 6.64% | 21.96% | ★★★★☆☆ |
| Eurofins-Cerep | 0.46% | 6.80% | 6.93% | ★★★★☆☆ |
Underneath we present a selection of stocks filtered out by our screen.
Treasure (OB:TRE)
Simply Wall St Value Rating: ★★★★★★
Overview: Treasure ASA operates primarily through its 11% interest in Hyundai Glovis Co. and has a market capitalization of NOK5.94 billion.
Operations: Treasure ASA's primary financial involvement is through its 11% stake in Hyundai Glovis Co., with a market capitalization of NOK5.94 billion. The company reports revenue from unclassified services amounting to $0.35 million.
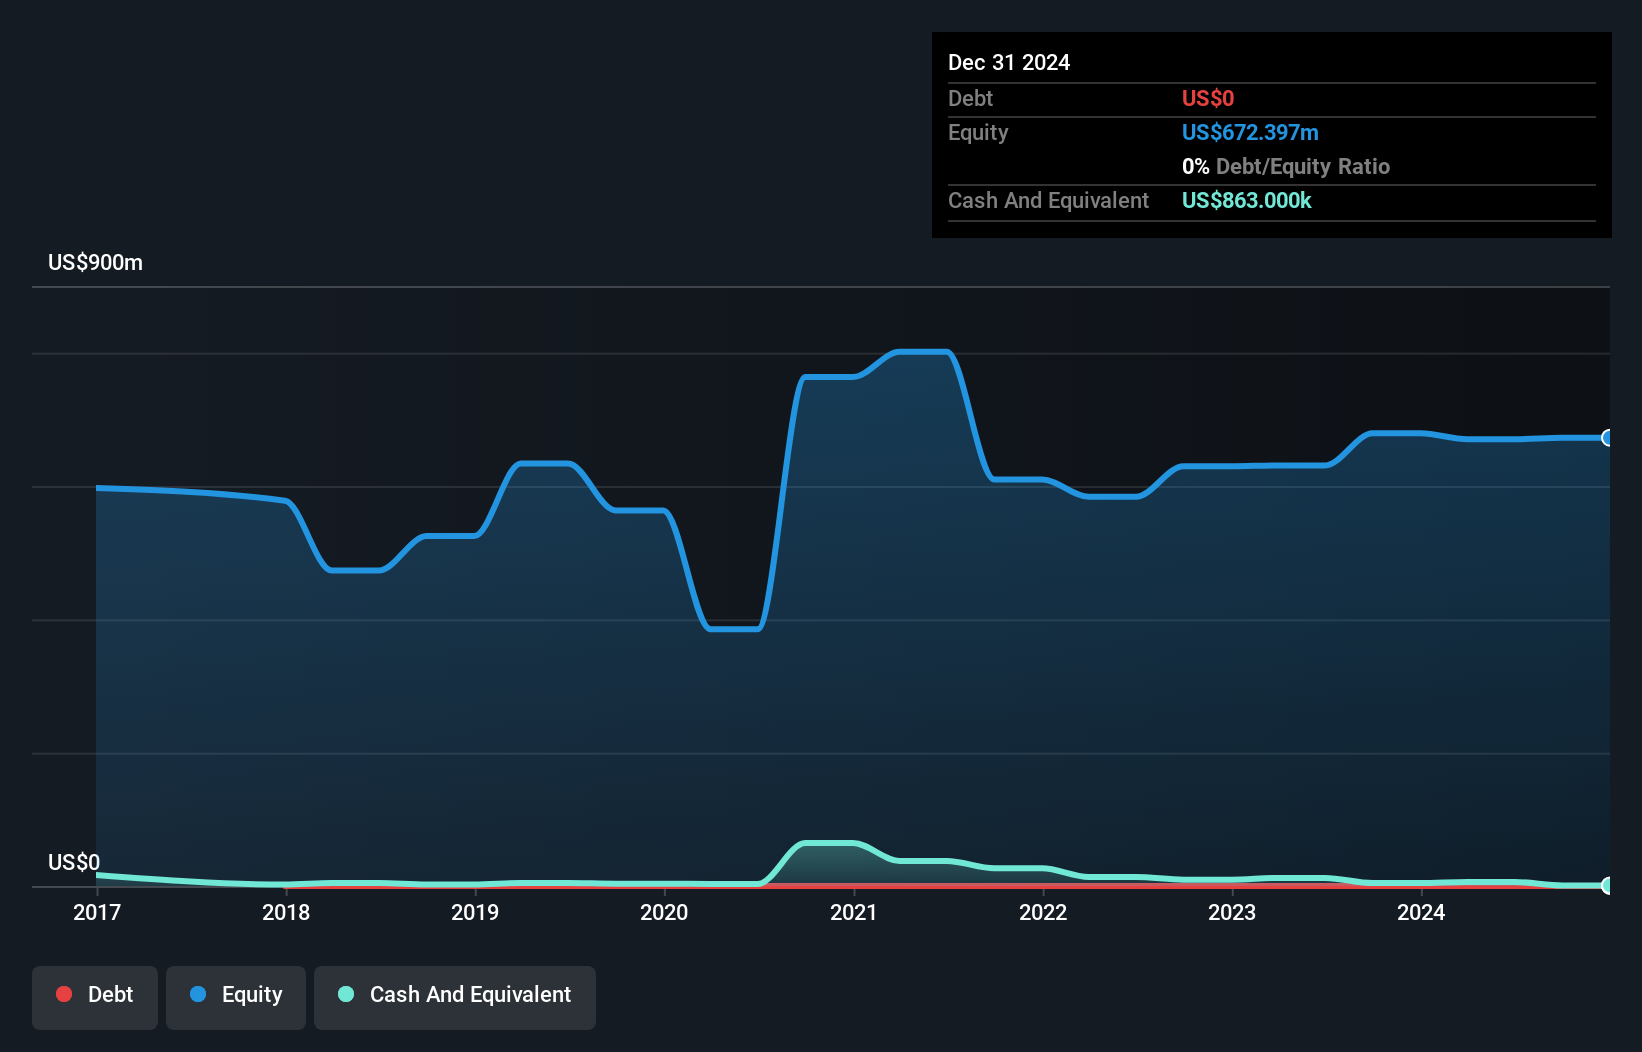
Treasure ASA, a nimble player in the logistics sector, has demonstrated resilience with earnings growth of 3.5% over the past year, outpacing the industry's -2.9%. Despite generating less than US$1 million in revenue ($354K), it boasts high-quality earnings and remains debt-free for five years. With a price-to-earnings ratio of 6.7x, Treasure appears undervalued compared to Norway's market average of 12x. The company is free cash flow positive but experiences share price volatility recently. Notably, an additional dividend was approved at NOK 0.20 per share following their annual general meeting in March 2025.
Electrolux Professional (OM:EPRO B)
Simply Wall St Value Rating: ★★★★★☆
Overview: Electrolux Professional AB (publ) provides food service, beverage, and laundry products and solutions to various service facilities such as restaurants, hotels, healthcare, and educational institutions, with a market cap of approximately SEK18.45 billion.
Operations: Electrolux Professional generates SEK12.60 billion in revenue, with SEK7.59 billion from Food & Beverage and SEK5.01 billion from Laundry segments.
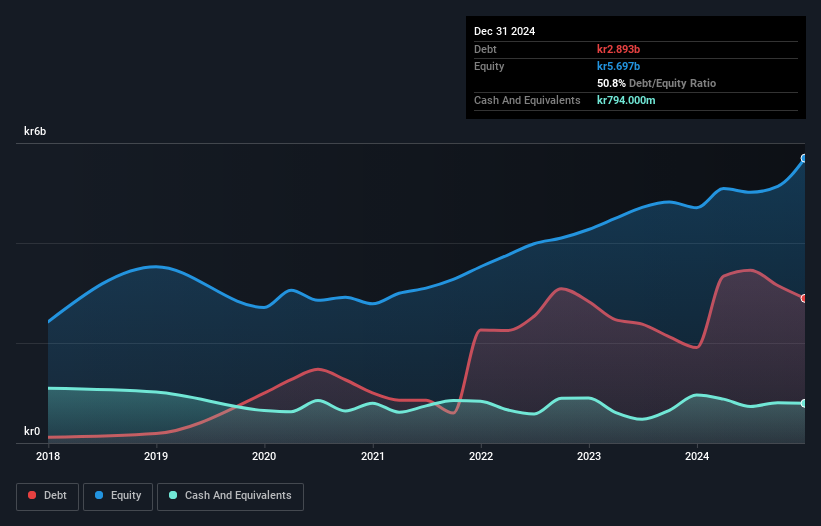
Electrolux Professional, a niche player in the European market, reported first-quarter sales of SEK 3.07 billion, slightly up from SEK 3.05 billion last year, with net income increasing to SEK 199 million from SEK 171 million. The company is trading at nearly half its estimated fair value and boasts high-quality earnings with a satisfactory net debt to equity ratio of 37.5%. Despite an increased debt-to-equity ratio over five years—from 41.4% to 51.5%—earnings growth outpaced the machinery industry at 9.9%. Recent board changes and dividend adjustments reflect ongoing strategic shifts within the organization.
Karnell Group (OM:KARNEL B)
Simply Wall St Value Rating: ★★★★★☆
Overview: Karnell Group AB (publ) is a private equity firm focusing on investments in add-on acquisitions, expansion, and small to medium-sized companies, with a market cap of SEK 2.86 billion.
Operations: Karnell Group generates revenue primarily from its Niche Production and Product Companies segments, with SEK 741.80 million and SEK 734.10 million, respectively.
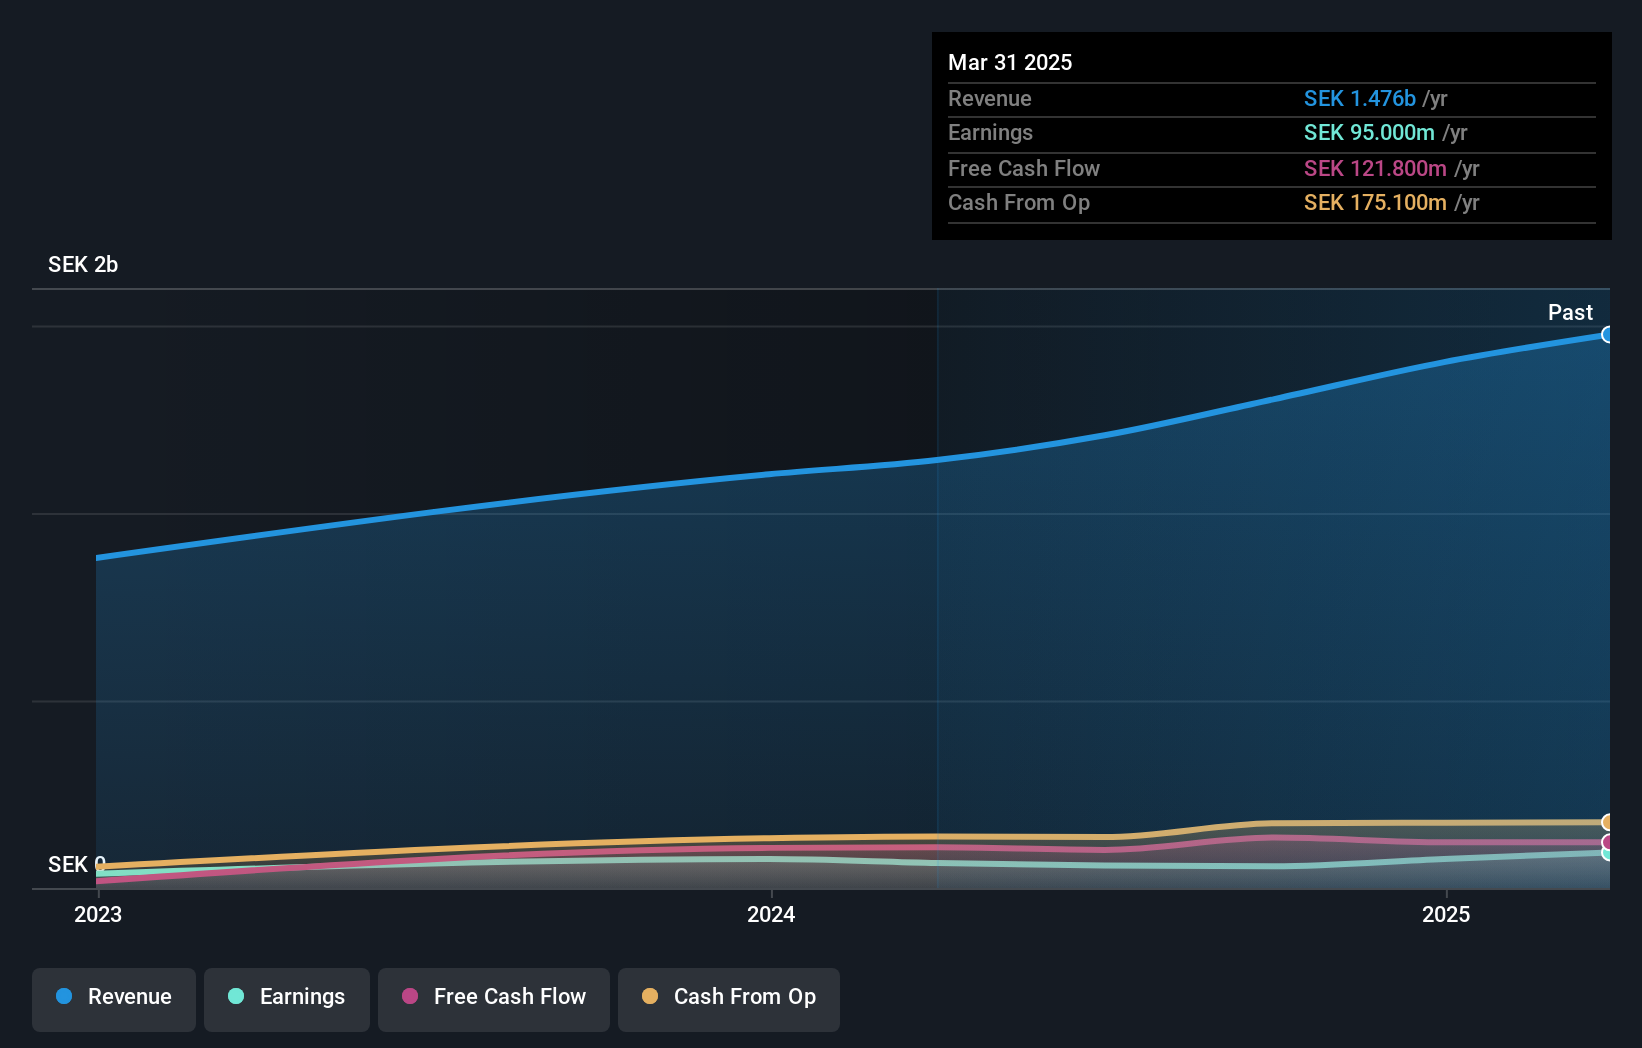
Karnell Group, a nimble player in the Industrials sector, has shown impressive earnings growth of 42.2% over the past year, outpacing its industry peers. The company reported a solid net income of SEK 19.7 million for Q1 2025, up from SEK 2.2 million the previous year, with basic earnings per share jumping to SEK 0.37 from SEK 0.05. Trading at approximately 32.9% below its estimated fair value suggests potential upside for investors seeking undervalued opportunities. Karnell's net debt to equity ratio stands at a satisfactory level of 20.2%, and interest payments are well covered by EBIT at a multiple of 6.4x, indicating robust financial health and operational efficiency as it explores new M&A opportunities under CEO Petter Moldenius’s guidance.
- Dive into the specifics of Karnell Group here with our thorough health report.
Assess Karnell Group's past performance with our detailed historical performance reports.
Summing It All Up
- Investigate our full lineup of 328 European Undiscovered Gems With Strong Fundamentals right here.
- Invested in any of these stocks? Simplify your portfolio management with Simply Wall St and stay ahead with our alerts for any critical updates on your stocks.
- Unlock the power of informed investing with Simply Wall St, your free guide to navigating stock markets worldwide.
Contemplating Other Strategies?
- Explore high-performing small cap companies that haven't yet garnered significant analyst attention.
- Fuel your portfolio with companies showing strong growth potential, backed by optimistic outlooks both from analysts and management.
- Find companies with promising cash flow potential yet trading below their fair value.
This article by Simply Wall St is general in nature. We provide commentary based on historical data and analyst forecasts only using an unbiased methodology and our articles are not intended to be financial advice. It does not constitute a recommendation to buy or sell any stock, and does not take account of your objectives, or your financial situation. We aim to bring you long-term focused analysis driven by fundamental data. Note that our analysis may not factor in the latest price-sensitive company announcements or qualitative material. Simply Wall St has no position in any stocks mentioned.
Valuation is complex, but we're here to simplify it.
Discover if Karnell Group might be undervalued or overvalued with our detailed analysis, featuring fair value estimates, potential risks, dividends, insider trades, and its financial condition.
Access Free AnalysisHave feedback on this article? Concerned about the content? Get in touch with us directly. Alternatively, email editorial-team@simplywallst.com
About OM:KARNEL B
Karnell Group
A private equity firm specializing investments in add-on acquisitions, expansion and small and medium-sized companies.
Solid track record with excellent balance sheet.
Similar Companies
Market Insights

Advertisement
Community Narratives
Pinterest will surge as advertising innovations ignite revenue growth
Fair Value US$42.63|26.3% undervalued
BR
Community Contributor
Brambles' Revenue Set to Climb 14% with Profit Margins Following
Fair Value AU$21.90|4.9% overvalued
RO
Community Contributor
Challenging Future for STG as Organic Sales Decline by 8.8%
Fair Value DKK 116.13|26.8% undervalued
KA
Community Contributor