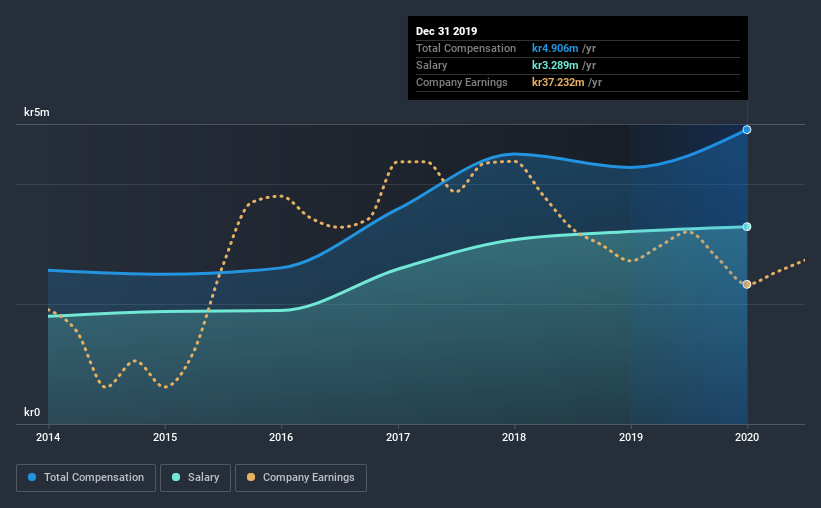
John Thuv is the CEO of Gyldendal ASA (OB:GYL), and in this article, we analyze the executive's compensation package with respect to the overall performance of the company. This analysis will also look to assess whether the CEO is appropriately paid, considering recent earnings growth and investor returns for Gyldendal.
Check out our latest analysis for Gyldendal
How Does Total Compensation For John Thuv Compare With Other Companies In The Industry?
At the time of writing, our data shows that Gyldendal ASA has a market capitalization of kr1.1b, and reported total annual CEO compensation of kr4.9m for the year to December 2019. Notably, that's an increase of 15% over the year before. Notably, the salary which is kr3.29m, represents most of the total compensation being paid.
In comparison with other companies in the industry with market capitalizations under kr1.8b, the reported median total CEO compensation was kr3.8m. This suggests that Gyldendal remunerates its CEO largely in line with the industry average.
| Component | 2019 | 2018 | Proportion (2019) |
| Salary | kr3.3m | kr3.2m | 67% |
| Other | kr1.6m | kr1.1m | 33% |
| Total Compensation | kr4.9m | kr4.3m | 100% |
Speaking on an industry level, nearly 63% of total compensation represents salary, while the remainder of 37% is other remuneration. There isn't a significant difference between Gyldendal and the broader market, in terms of salary allocation in the overall compensation package. If salary is the major component in total compensation, it suggests that the CEO receives a higher fixed proportion of the total compensation, regardless of performance.

Gyldendal ASA's Growth
Over the last three years, Gyldendal ASA has shrunk its earnings per share by 11% per year. It achieved revenue growth of 4.6% over the last year.
Overall this is not a very positive result for shareholders. And the modest revenue growth over 12 months isn't much comfort against the reduced EPS. These factors suggest that the business performance wouldn't really justify a high pay packet for the CEO. We don't have analyst forecasts, but you could get a better understanding of its growth by checking out this more detailed historical graph of earnings, revenue and cash flow.
Has Gyldendal ASA Been A Good Investment?
Boasting a total shareholder return of 49% over three years, Gyldendal ASA has done well by shareholders. This strong performance might mean some shareholders don't mind if the CEO were to be paid more than is normal for a company of its size.
In Summary...
As previously discussed, John is compensated close to the median for companies of its size, and which belong to the same industry. Some investors may take issue with this, especially considering shrinking EPS for the past three years. On the other hand, shareholder returns are showing positive trends over the same time frame. We wouldn't say CEO compensation is too high, but shrinking EPS is undoubtedly an issue that will have to be addressed.
CEO compensation can have a massive impact on performance, but it's just one element. That's why we did some digging and identified 1 warning sign for Gyldendal that you should be aware of before investing.
Switching gears from Gyldendal, if you're hunting for a pristine balance sheet and premium returns, this free list of high return, low debt companies is a great place to look.
If you decide to trade Gyldendal, use the lowest-cost* platform that is rated #1 Overall by Barron’s, Interactive Brokers. Trade stocks, options, futures, forex, bonds and funds on 135 markets, all from a single integrated account. Promoted
If you're looking to trade Gyldendal, open an account with the lowest-cost platform trusted by professionals, Interactive Brokers.
With clients in over 200 countries and territories, and access to 160 markets, IBKR lets you trade stocks, options, futures, forex, bonds and funds from a single integrated account.
Enjoy no hidden fees, no account minimums, and FX conversion rates as low as 0.03%, far better than what most brokers offer.
Sponsored ContentNew: Manage All Your Stock Portfolios in One Place
We've created the ultimate portfolio companion for stock investors, and it's free.
• Connect an unlimited number of Portfolios and see your total in one currency
• Be alerted to new Warning Signs or Risks via email or mobile
• Track the Fair Value of your stocks
This article by Simply Wall St is general in nature. It does not constitute a recommendation to buy or sell any stock, and does not take account of your objectives, or your financial situation. We aim to bring you long-term focused analysis driven by fundamental data. Note that our analysis may not factor in the latest price-sensitive company announcements or qualitative material. Simply Wall St has no position in any stocks mentioned.
*Interactive Brokers Rated Lowest Cost Broker by StockBrokers.com Annual Online Review 2020
Have feedback on this article? Concerned about the content? Get in touch with us directly. Alternatively, email editorial-team@simplywallst.com.
About OB:GYL
Gyldendal
Through its subsidiaries, engages in the publishing of books in Norway.
Adequate balance sheet slight.
Market Insights
Community Narratives


