
Advertisement
- Norway
- /
- Medical Equipment
- /
- OB:GENT
Gentian Diagnostics (OB:GENT) delivers shareholders notable 40% return over 1 year, surging 14% in the last week alone

If you want to compound wealth in the stock market, you can do so by buying an index fund. But you can significantly boost your returns by picking above-average stocks. To wit, the Gentian Diagnostics ASA (OB:GENT) share price is 39% higher than it was a year ago, much better than the market decline of around 1.1% (not including dividends) in the same period. So that should have shareholders smiling. Also impressive, the stock is up 32% over three years, making long term shareholders happy, too.
Since the stock has added kr102m to its market cap in the past week alone, let's see if underlying performance has been driving long-term returns.
To quote Buffett, 'Ships will sail around the world but the Flat Earth Society will flourish. There will continue to be wide discrepancies between price and value in the marketplace...' One flawed but reasonable way to assess how sentiment around a company has changed is to compare the earnings per share (EPS) with the share price.
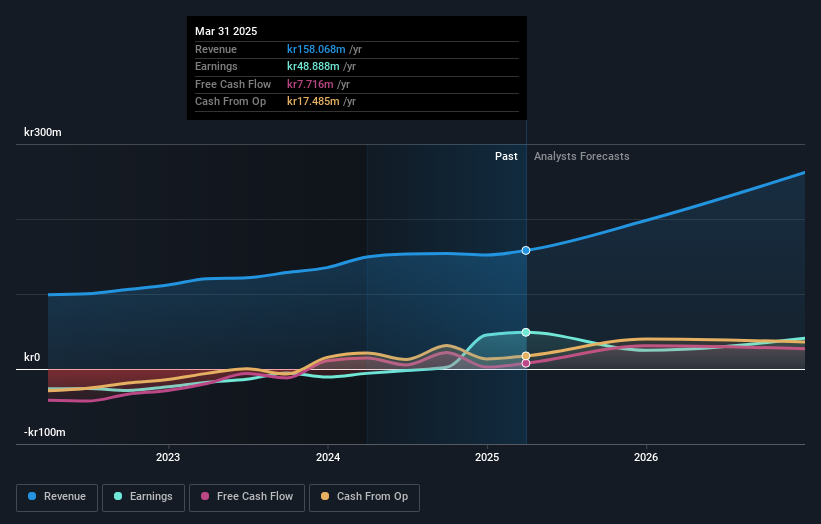
During the last year Gentian Diagnostics grew its earnings per share, moving from a loss to a profit.
When a company has just transitioned to profitability, earnings per share growth is not always the best way to look at the share price action.
We doubt the modest 0.7% dividend yield is doing much to support the share price. We think that the revenue growth of 5.8% could have some investors interested. Many businesses do go through a phase where they have to forgo some profits to drive business development, and sometimes its for the best.
The graphic below depicts how earnings and revenue have changed over time (unveil the exact values by clicking on the image).
We know that Gentian Diagnostics has improved its bottom line over the last three years, but what does the future have in store? This free interactive report on Gentian Diagnostics' balance sheet strength is a great place to start, if you want to investigate the stock further.
A Different Perspective
It's nice to see that Gentian Diagnostics shareholders have received a total shareholder return of 40% over the last year. That's including the dividend. That gain is better than the annual TSR over five years, which is 2%. Therefore it seems like sentiment around the company has been positive lately. In the best case scenario, this may hint at some real business momentum, implying that now could be a great time to delve deeper. While it is well worth considering the different impacts that market conditions can have on the share price, there are other factors that are even more important. Take risks, for example - Gentian Diagnostics has 3 warning signs (and 2 which are significant) we think you should know about.
If you are like me, then you will not want to miss this free list of undervalued small caps that insiders are buying.
Please note, the market returns quoted in this article reflect the market weighted average returns of stocks that currently trade on Norwegian exchanges.
New: Manage All Your Stock Portfolios in One Place
We've created the ultimate portfolio companion for stock investors, and it's free.
• Connect an unlimited number of Portfolios and see your total in one currency
• Be alerted to new Warning Signs or Risks via email or mobile
• Track the Fair Value of your stocks
Have feedback on this article? Concerned about the content? Get in touch with us directly. Alternatively, email editorial-team (at) simplywallst.com.
This article by Simply Wall St is general in nature. We provide commentary based on historical data and analyst forecasts only using an unbiased methodology and our articles are not intended to be financial advice. It does not constitute a recommendation to buy or sell any stock, and does not take account of your objectives, or your financial situation. We aim to bring you long-term focused analysis driven by fundamental data. Note that our analysis may not factor in the latest price-sensitive company announcements or qualitative material. Simply Wall St has no position in any stocks mentioned.
About OB:GENT
Gentian Diagnostics
Develops, manufactures, and sells biochemical reagents for use in medical diagnostics and research in the United States, Asia, and Europe.
Flawless balance sheet with acceptable track record.
Market Insights

Advertisement
Community Narratives

Apple: A Dying Star with an Overpriced Valuation
Fair Value US$177.34|19.2% overvalued
IN
Community Contributor
Avino a case for USD$20 per share within 5 years (assuming $3,500 gold, $100 silver and $4 copper).
Fair Value CA$26.79|86.0% undervalued
AG
Community Contributor
Riding the Defense Boom RENK Sees Revenue Climb at 15% CAGR by FY 2029
Fair Value €69.87|20.5% undervalued
CH
Community Contributor