Advertisement
- Italy
- /
- Personal Products
- /
- BIT:ICOS
European Growth Companies With Strong Insider Ownership

Simply Wall St
Reviewed by Simply Wall St
The European market recently experienced a downturn, with the STOXX Europe 600 Index falling 1.10% as investors took profits after record highs and faced pressures from political turmoil in France and international trade tensions. Amidst this backdrop of uncertainty, growth companies with high insider ownership can be appealing as they often reflect strong internal confidence and alignment between management and shareholder interests, potentially providing stability in volatile markets.
Top 10 Growth Companies With High Insider Ownership In Europe
| Name | Insider Ownership | Earnings Growth |
| XTPL (WSE:XTP) | 23.3% | 107.3% |
| Xbrane Biopharma (OM:XBRANE) | 13% | 112.0% |
| Pharma Mar (BME:PHM) | 11.9% | 44.2% |
| MedinCell (ENXTPA:MEDCL) | 12.5% | 90.8% |
| KebNi (OM:KEBNI B) | 36.3% | 63.7% |
| Elliptic Laboratories (OB:ELABS) | 24.4% | 97.7% |
| CTT Systems (OM:CTT) | 17.5% | 37.9% |
| Circus (XTRA:CA1) | 24.5% | 67.1% |
| CD Projekt (WSE:CDR) | 29.7% | 43.1% |
| Bonesupport Holding (OM:BONEX) | 10.4% | 59.3% |
Let's explore several standout options from the results in the screener.
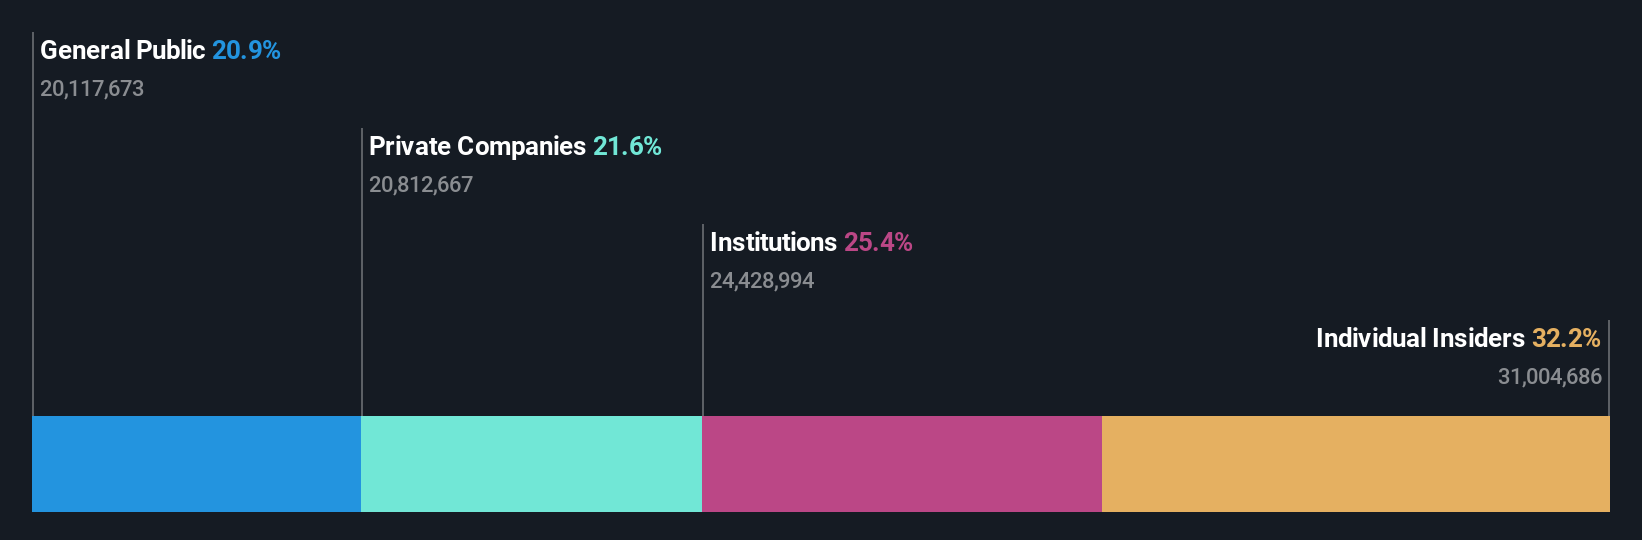
Intercos (BIT:ICOS)
Simply Wall St Growth Rating: ★★★★☆☆
Overview: Intercos S.p.A., along with its subsidiaries, is engaged in the creation, production, and marketing of cosmetics and skincare products globally, with a market cap of €1.14 billion.
Operations: The company's revenue is derived from three primary segments: Make up Line (€669.58 million), Skin Care Line (€162.14 million), and Hair & Body Line (€258.18 million).
Insider Ownership: 32.2%
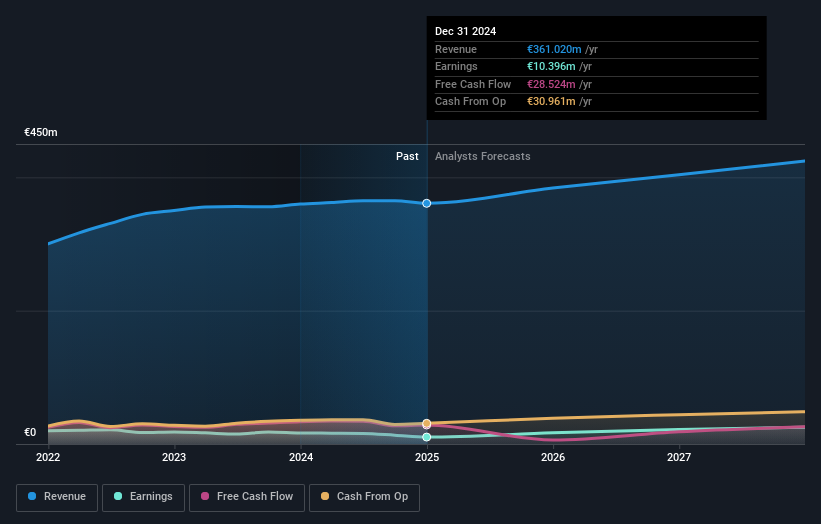
Earnings Growth Forecast: 21.3% p.a.
Intercos shows promising growth potential with earnings expected to increase by 21.25% annually, outpacing the Italian market's 9.6%. Despite a modest revenue growth forecast of 5%, it still surpasses the national average. Analysts anticipate a stock price rise of 44%, although Return on Equity is projected to be relatively low at 13.7%. Recent earnings reports show sales up to €524.91 million, though net income slightly decreased compared to last year.
- Click to explore a detailed breakdown of our findings in Intercos' earnings growth report.
- Our expertly prepared valuation report Intercos implies its share price may be lower than expected.
Etteplan Oyj (HLSE:ETTE)
Simply Wall St Growth Rating: ★★★★☆☆
Overview: Etteplan Oyj offers software and embedded solutions, industrial equipment and plant engineering, and technical communication services across Finland, Scandinavia, China, and Central Europe with a market cap of €255.02 million.
Operations: Etteplan Oyj generates its revenue from three main segments: Engineering Solutions (€195.31 million), Software and Embedded Solutions (€90.75 million), and Technical Communication Solutions (€71.29 million).
Insider Ownership: 14.1%
Earnings Growth Forecast: 29.5% p.a.
Etteplan Oyj's earnings are forecast to grow significantly at 29.5% annually, surpassing the Finnish market's 15.8%. However, its recent financial results show a decline in net income and sales compared to last year, with Q2 sales at €91.43 million and net income at €2.47 million. Despite trading below its estimated fair value, the company faces challenges with high debt levels and lowered annual revenue guidance due to market uncertainties.
- Take a closer look at Etteplan Oyj's potential here in our earnings growth report.
- Insights from our recent valuation report point to the potential undervaluation of Etteplan Oyj shares in the market.
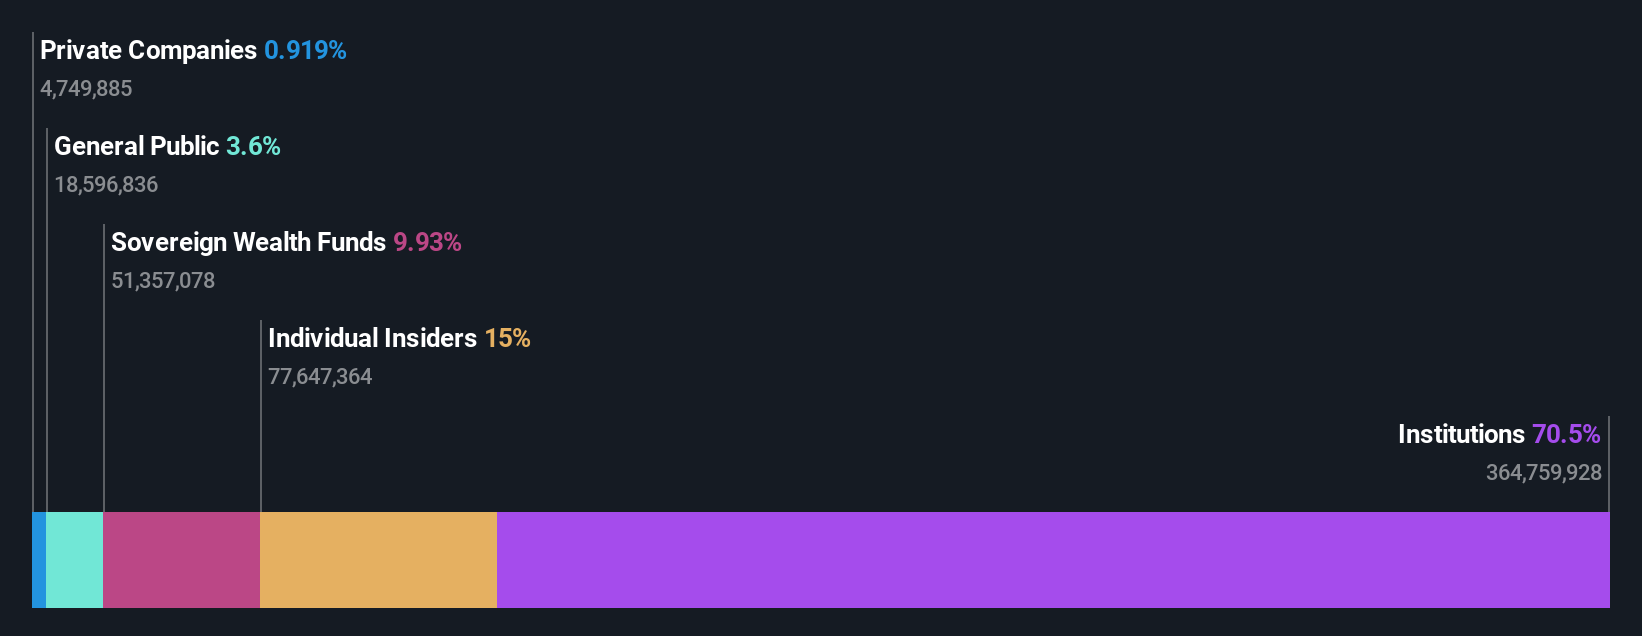
Mowi (OB:MOWI)
Simply Wall St Growth Rating: ★★★★☆☆
Overview: Mowi ASA is a seafood company that produces and sells Atlantic salmon products globally, with a market cap of NOK114.28 billion.
Operations: Mowi ASA's revenue is primarily derived from its Farming segment (€3.59 billion), Sales & Marketing - Markets (€4.16 billion), and Sales and Marketing - Consumer Products (€3.73 billion), with additional contributions from its Feed segment (€1.12 billion).
Insider Ownership: 15%
Earnings Growth Forecast: 40.8% p.a.
Mowi's earnings are expected to grow significantly at 40.8% annually, outpacing the Norwegian market's 13.4%. Despite a high debt level and a recent decline in profit margins from 9% to 5.9%, Mowi is trading at over half below its estimated fair value. Recent results show increased Q2 sales of €1.39 billion and net income of €46 million, with improved harvest volumes guiding higher production targets for the upcoming year, indicating robust growth potential.
- Delve into the full analysis future growth report here for a deeper understanding of Mowi.
- Our comprehensive valuation report raises the possibility that Mowi is priced lower than what may be justified by its financials.
Key Takeaways
- Get an in-depth perspective on all 183 Fast Growing European Companies With High Insider Ownership by using our screener here.
- Interested In Other Possibilities? Diversify your portfolio with solid dividend payers offering reliable income streams to weather potential market turbulence.
This article by Simply Wall St is general in nature. We provide commentary based on historical data and analyst forecasts only using an unbiased methodology and our articles are not intended to be financial advice. It does not constitute a recommendation to buy or sell any stock, and does not take account of your objectives, or your financial situation. We aim to bring you long-term focused analysis driven by fundamental data. Note that our analysis may not factor in the latest price-sensitive company announcements or qualitative material. Simply Wall St has no position in any stocks mentioned.The analysis only considers stock directly held by insiders. It does not include indirectly owned stock through other vehicles such as corporate and/or trust entities. All forecast revenue and earnings growth rates quoted are in terms of annualised (per annum) growth rates over 1-3 years.
New: AI Stock Screener & Alerts
Our new AI Stock Screener scans the market every day to uncover opportunities.
• Dividend Powerhouses (3%+ Yield)
• Undervalued Small Caps with Insider Buying
• High growth Tech and AI Companies
Or build your own from over 50 metrics.
Have feedback on this article? Concerned about the content? Get in touch with us directly. Alternatively, email editorial-team@simplywallst.com
About BIT:ICOS
Intercos
Intercos S.p.A., together with its subsidiaries, creates, produces, and markets cosmetics and skin care products worldwide.
Flawless balance sheet and fair value.
Market Insights

Advertisement
Community Narratives
Kodiak AI - a potential 100 bagger opportunity?
Fair Value US$14.00|44.7% undervalued
DA
Community Contributor
A Fair Price for a Great Business Facing Real Threats
Fair Value US$383.06|13.0% undervalued
IM
Community Contributor
AXON And Shopify Integration Will Unlock Global Mobile Advertising
Fair Value US$646.30|7.3% undervalued
AN
Based on Analyst Price Targets