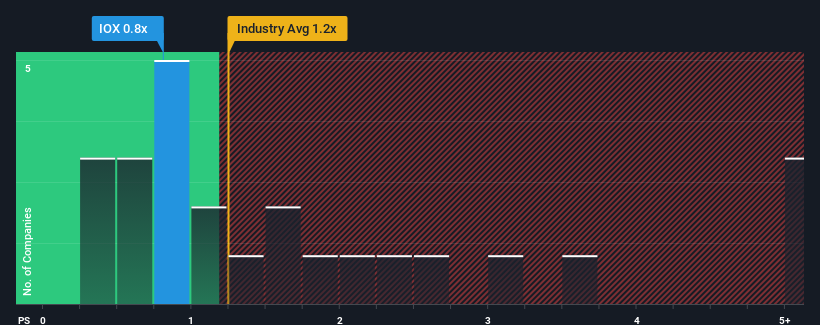
It's not a stretch to say that Interoil Exploration and Production ASA's (OB:IOX) price-to-sales (or "P/S") ratio of 0.8x right now seems quite "middle-of-the-road" for companies in the Oil and Gas industry in Norway, where the median P/S ratio is around 1.2x. However, investors might be overlooking a clear opportunity or potential setback if there is no rational basis for the P/S.
View our latest analysis for Interoil Exploration and Production

What Does Interoil Exploration and Production's Recent Performance Look Like?
Revenue has risen firmly for Interoil Exploration and Production recently, which is pleasing to see. Perhaps the market is expecting future revenue performance to only keep up with the broader industry, which has keeping the P/S in line with expectations. If that doesn't eventuate, then existing shareholders probably aren't too pessimistic about the future direction of the share price.
Although there are no analyst estimates available for Interoil Exploration and Production, take a look at this free data-rich visualisation to see how the company stacks up on earnings, revenue and cash flow.What Are Revenue Growth Metrics Telling Us About The P/S?
In order to justify its P/S ratio, Interoil Exploration and Production would need to produce growth that's similar to the industry.
If we review the last year of revenue growth, the company posted a worthy increase of 13%. However, due to its less than impressive performance prior to this period, revenue growth is practically non-existent over the last three years overall. So it appears to us that the company has had a mixed result in terms of growing revenue over that time.
In contrast to the company, the rest of the industry is expected to decline by 12% over the next year, which puts the company's recent medium-term positive growth rates in a good light for now.
With this in mind, we find it intriguing that Interoil Exploration and Production's P/S matches its industry peers. Apparently some shareholders believe the recent performance is at its limits and have been accepting lower selling prices.
What Does Interoil Exploration and Production's P/S Mean For Investors?
Typically, we'd caution against reading too much into price-to-sales ratios when settling on investment decisions, though it can reveal plenty about what other market participants think about the company.
Our examination of Interoil Exploration and Production revealed its growing revenue over the medium-term hasn't helped elevate its P/S above that of the industry, which is surprising given the industry is set to shrink. There could be some unobserved threats to revenue preventing the P/S ratio from outpacing the industry much like its revenue performance. Perhaps there is some hesitation about the company's ability to stay its recent course and swim against the current of the broader industry turmoil. The fact that the company's relative performance has not provided a kick to the share price suggests that some investors are anticipating revenue instability.
It is also worth noting that we have found 4 warning signs for Interoil Exploration and Production (2 are a bit concerning!) that you need to take into consideration.
If you're unsure about the strength of Interoil Exploration and Production's business, why not explore our interactive list of stocks with solid business fundamentals for some other companies you may have missed.
New: AI Stock Screener & Alerts
Our new AI Stock Screener scans the market every day to uncover opportunities.
• Dividend Powerhouses (3%+ Yield)
• Undervalued Small Caps with Insider Buying
• High growth Tech and AI Companies
Or build your own from over 50 metrics.
Have feedback on this article? Concerned about the content? Get in touch with us directly. Alternatively, email editorial-team (at) simplywallst.com.
This article by Simply Wall St is general in nature. We provide commentary based on historical data and analyst forecasts only using an unbiased methodology and our articles are not intended to be financial advice. It does not constitute a recommendation to buy or sell any stock, and does not take account of your objectives, or your financial situation. We aim to bring you long-term focused analysis driven by fundamental data. Note that our analysis may not factor in the latest price-sensitive company announcements or qualitative material. Simply Wall St has no position in any stocks mentioned.
About OB:IOX
Interoil Exploration and Production
Operates as an upstream oil exploration and production company in Argentina and Colombia.
Good value slight.
Market Insights
Community Narratives


