Advertisement
- Norway
- /
- Energy Services
- /
- OB:DOFG
Is DOF Group’s Share Price Still Attractive After Recent 14% Gain in 2025?

Simply Wall St
Reviewed by Bailey Pemberton
If you are thinking about what to do with DOF Group stock right now, you are not alone. With the share price closing at 99.7 and up by 1.6% over the last 7 days, the stock is definitely moving, and not just on a whim. Over the past month, DOF Group has tallied a 2.7% gain, and the year-to-date return is an impressive 14.1%. That momentum has caught the eye of many investors, especially since some recent market developments have altered how risk and growth prospects are viewed across the sector.
It is easy to get swept up in the excitement of short-term movements, but whether you are holding, buying, or just watching, the real question is how DOF Group stacks up in terms of underlying value. Here is a key signal: using a detailed valuation scorecard that checks for signs of undervaluation across six industry-standard tests, DOF Group clocks in at 5 out of 6. That means the company is coming up undervalued on nearly every front that matters.
Of course, every valuation method has its strengths and weaknesses, and not every metric fits every investor. In this article, we will break down the main valuation approaches one by one. And at the end, we will share a perspective on valuation that might surprise you and could be even more useful than the usual checklist.
Approach 1: DOF Group Discounted Cash Flow (DCF) Analysis
The Discounted Cash Flow (DCF) model estimates a company's intrinsic value by projecting its future cash flows and then discounting those amounts back to their present value. This approach helps investors understand whether a stock is trading above or below what its future cash generation potential suggests.
For DOF Group, the current Free Cash Flow stands at $311.8 million. Analyst forecasts provide annual growth estimates out to 2027, with Free Cash Flow expected to reach $515.1 million by that time. Beyond 2027, further cash flow projections are extrapolated, showing a steady increase through 2035, based on modest growth assumptions.
After modeling these cash flows and discounting them to today's dollars, the estimated intrinsic value per share is $392.55. Compared to DOF Group's recent share price, this suggests the stock is trading at a 74.6% discount to its intrinsic value, implying it is significantly undervalued according to this method.
Result: UNDERVALUED
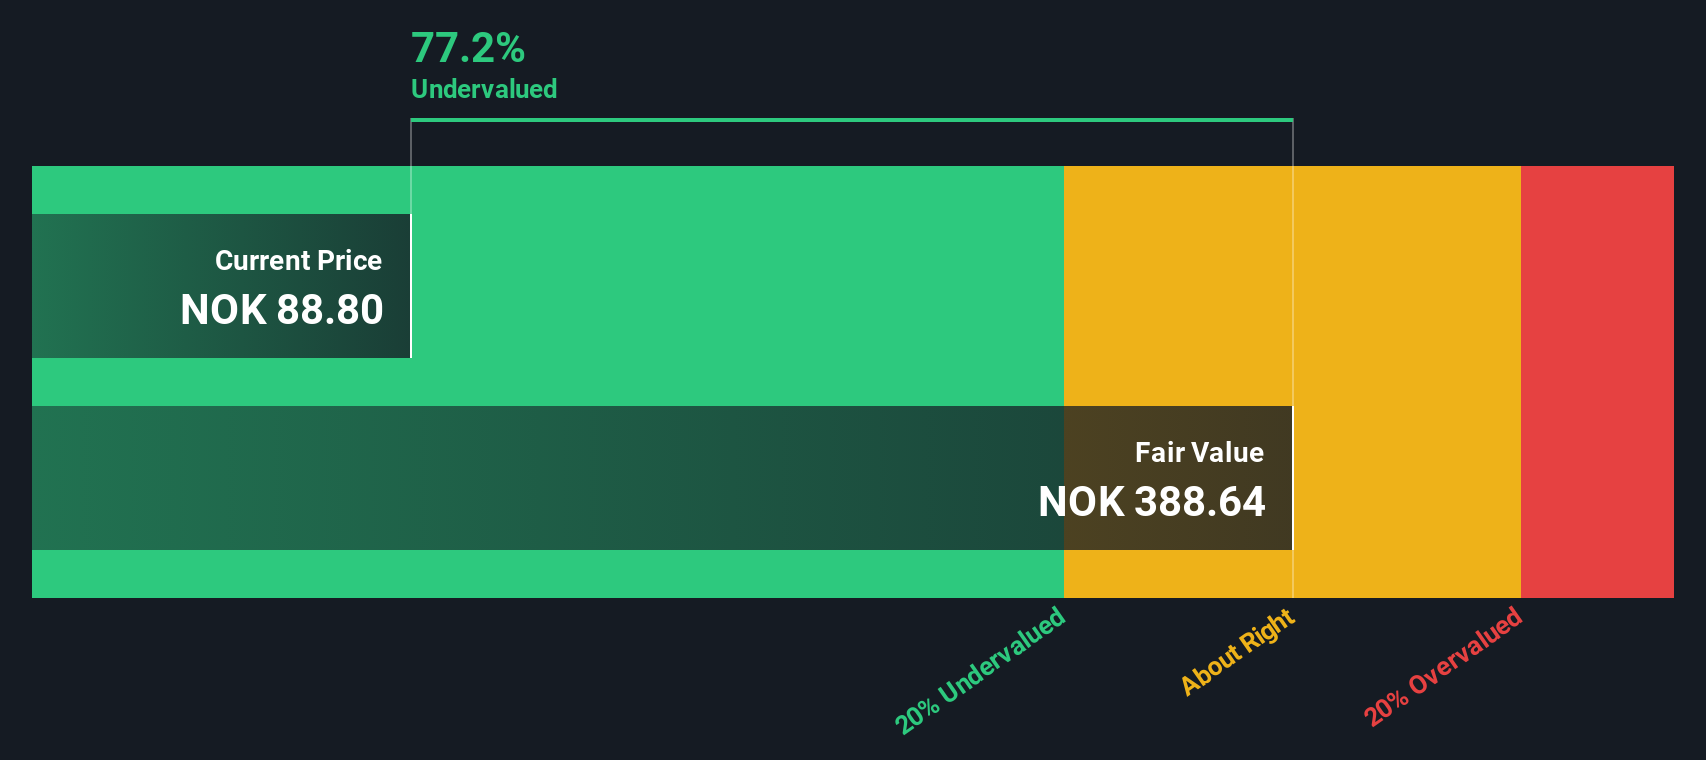
Our Discounted Cash Flow (DCF) analysis suggests DOF Group is undervalued by 74.6%. Track this in your watchlist or portfolio, or discover more undervalued stocks.
Approach 2: DOF Group Price vs Earnings (PE)
The Price-to-Earnings (PE) ratio is a widely used tool for valuing profitable companies, as it shows how much investors are willing to pay per unit of earnings. When a company has steady profits, the PE ratio gives a direct sense of how the market views its future prospects and risk profile compared to the amount it earns today.
What is considered a "normal" or "fair" PE ratio depends on a mix of factors. Companies expected to grow faster, or those viewed as safer, typically command higher PE ratios. Conversely, slow-growing or riskier companies tend to trade at lower multiples, as investors are less willing to pay a premium for uncertain or stagnant earnings.
For DOF Group, the current PE ratio sits at 6.55x. This is almost identical to the Energy Services industry average of 6.53x and noticeably below the peer group average of 23.21x. However, benchmarks like industry and peer averages do not account for the unique factors at play for DOF Group itself.
This is where Simply Wall St’s proprietary “Fair Ratio” comes in. The Fair Ratio for DOF Group is calculated at 8.21x. Unlike generic comparisons, this metric blends the company’s earnings growth, profit margins, risk profile, industry context, and market capitalization into a single figure that reflects a customized fair PE. As a result, it offers a more nuanced and reliable benchmark than simply lining up DOF Group against industry averages or similar companies.
Comparing DOF Group’s current PE of 6.55x to its Fair Ratio of 8.21x suggests that the stock is trading below what is justified by its financials and outlook, pointing to undervaluation.
Result: UNDERVALUED

PE ratios tell one story, but what if the real opportunity lies elsewhere? Discover companies where insiders are betting big on explosive growth.
Upgrade Your Decision Making: Choose your DOF Group Narrative
Earlier we mentioned that there is an even better way to understand valuation, so let us introduce you to Narratives. A Narrative is essentially your story about a company; it is how you tie together what you think will happen to revenue, profit margins, and future growth, and use those beliefs to calculate a fair value and assess whether the share price looks cheap or expensive.
Narratives make investing more accessible by connecting the company's latest developments, your outlook, and actual financial forecasts, showing you how changing one assumption can impact everything from future earnings to fair value. This tool is built for everyday investors, and is available for DOF Group and thousands of stocks on Simply Wall St’s Community page, where millions of investors use Narratives to shape their investment decisions.
With Narratives, you can track at a glance how your Fair Value compares to DOF Group’s current price, helping you decide whether it is the right time to buy, hold, or sell. Each Narrative updates in real time whenever big news, earnings, or company events come in, so your decision-making stays dynamic and up to date.
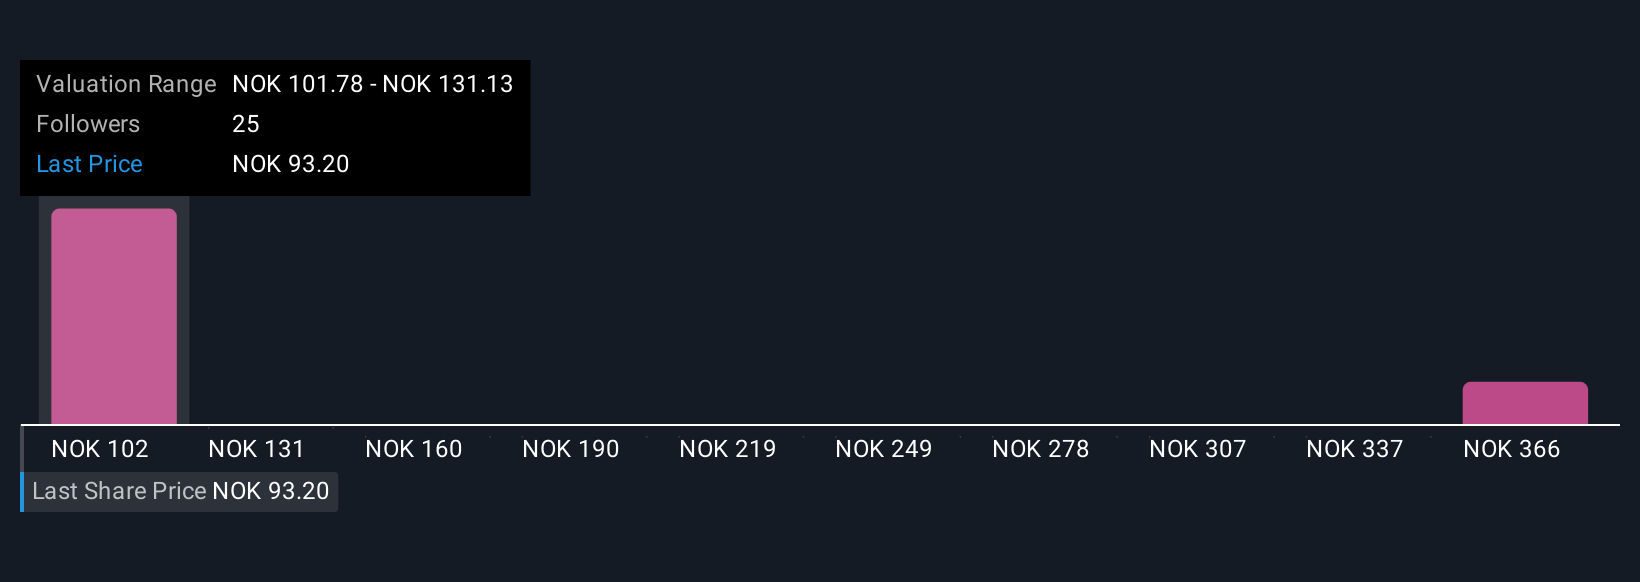
For example, some investors are currently forecasting DOF Group’s fair value as high as NOK125.00, based on robust contract wins and upgraded revenue growth expectations, while others see it as low as NOK97.50 due to concerns about debt or regional risks. Your own Narrative can be tailored to reflect your assessment and instantly show what that means for today’s share price.
Do you think there's more to the story for DOF Group? Create your own Narrative to let the Community know!
This article by Simply Wall St is general in nature. We provide commentary based on historical data and analyst forecasts only using an unbiased methodology and our articles are not intended to be financial advice. It does not constitute a recommendation to buy or sell any stock, and does not take account of your objectives, or your financial situation. We aim to bring you long-term focused analysis driven by fundamental data. Note that our analysis may not factor in the latest price-sensitive company announcements or qualitative material. Simply Wall St has no position in any stocks mentioned.
New: Manage All Your Stock Portfolios in One Place
We've created the ultimate portfolio companion for stock investors, and it's free.
• Connect an unlimited number of Portfolios and see your total in one currency
• Be alerted to new Warning Signs or Risks via email or mobile
• Track the Fair Value of your stocks
Have feedback on this article? Concerned about the content? Get in touch with us directly. Alternatively, email editorial-team@simplywallst.com
About OB:DOFG
Very undervalued with adequate balance sheet.
Similar Companies
Market Insights

Advertisement
Community Narratives
A formidable player in AI and enterprise computing.
Fair Value US$210.00|3.9% overvalued
CO
Community Contributor
IREN's Bold Moves in Sustainable Bitcoin Mining & AI Data Centers
Fair Value US$72.52|4.1% undervalued
BL
Community Contributor
Cooling the Champions: The Aussie Tech Behind F1's Victories
Fair Value AU$12.40|39.4% undervalued
TR
Community Contributor