
Advertisement
- Norway
- /
- Commercial Services
- /
- OB:OCEAN
It's Down 32% But Ocean GeoLoop AS (OB:OCEAN) Could Be Riskier Than It Looks
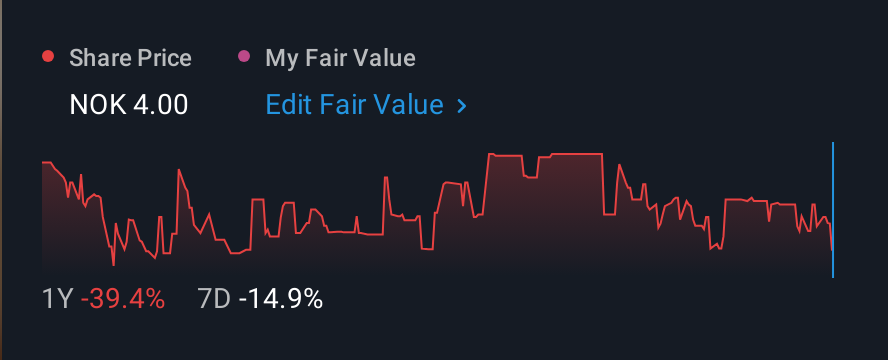
Unfortunately for some shareholders, the Ocean GeoLoop AS (OB:OCEAN) share price has dived 32% in the last thirty days, prolonging recent pain. The drop over the last 30 days has capped off a tough year for shareholders, with the share price down 47% in that time.
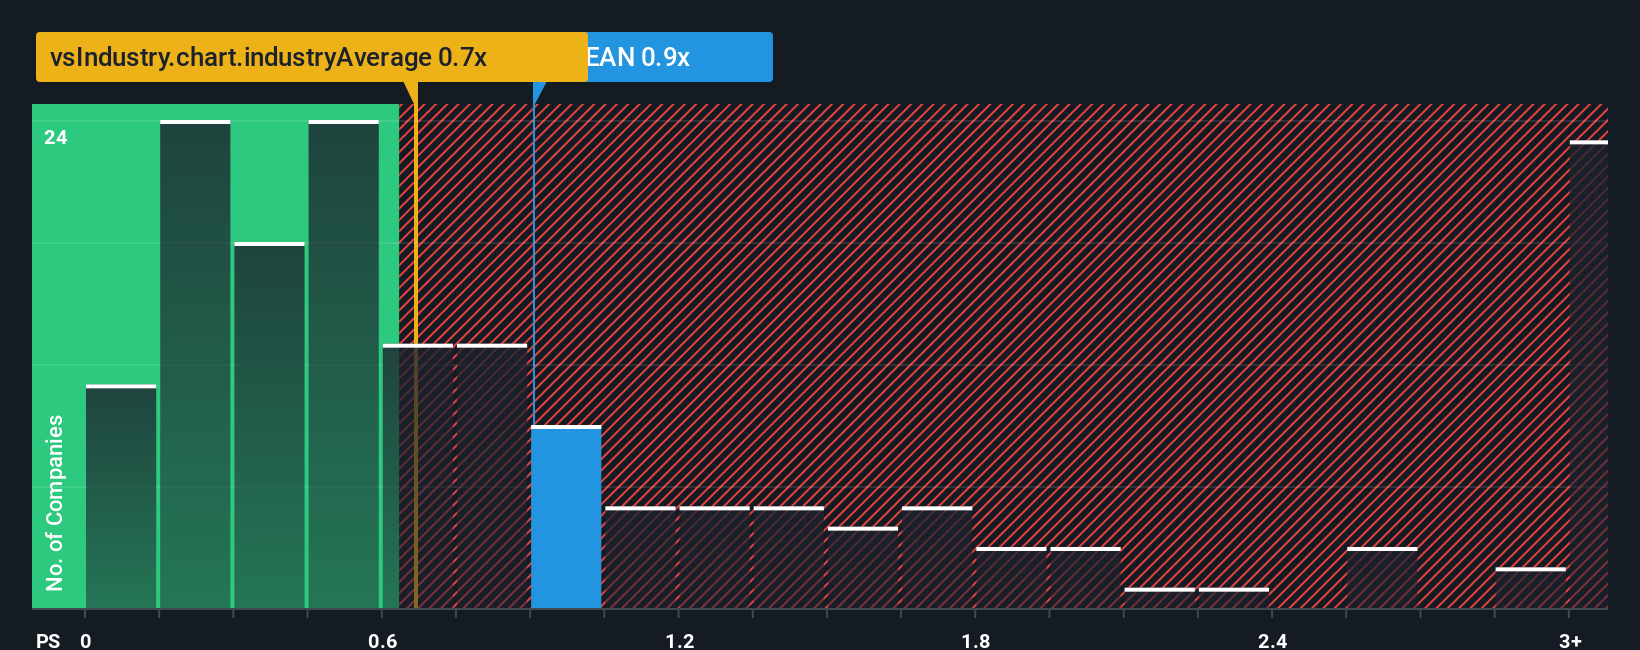
Since its price has dipped substantially, Ocean GeoLoop's price-to-sales (or "P/S") ratio of 0.9x might make it look like a strong buy right now compared to the wider Commercial Services industry in Norway, where around half of the companies have P/S ratios above 9.6x and even P/S above 40x are quite common. However, the P/S might be quite low for a reason and it requires further investigation to determine if it's justified.
View our latest analysis for Ocean GeoLoop
How Has Ocean GeoLoop Performed Recently?
Ocean GeoLoop certainly has been doing a great job lately as it's been growing its revenue at a really rapid pace. One possibility is that the P/S ratio is low because investors think this strong revenue growth might actually underperform the broader industry in the near future. If you like the company, you'd be hoping this isn't the case so that you could potentially pick up some stock while it's out of favour.
Although there are no analyst estimates available for Ocean GeoLoop, take a look at this free data-rich visualisation to see how the company stacks up on earnings, revenue and cash flow.Do Revenue Forecasts Match The Low P/S Ratio?
The only time you'd be truly comfortable seeing a P/S as depressed as Ocean GeoLoop's is when the company's growth is on track to lag the industry decidedly.
Taking a look back first, we see that the company grew revenue by an impressive 36% last year. Spectacularly, three year revenue growth has ballooned by several orders of magnitude, thanks in part to the last 12 months of revenue growth. Accordingly, shareholders would have been over the moon with those medium-term rates of revenue growth.
Comparing that recent medium-term revenue trajectory with the industry's one-year growth forecast of 6.7% shows it's noticeably more attractive.
In light of this, it's peculiar that Ocean GeoLoop's P/S sits below the majority of other companies. It looks like most investors are not convinced the company can maintain its recent growth rates.
The Bottom Line On Ocean GeoLoop's P/S
Having almost fallen off a cliff, Ocean GeoLoop's share price has pulled its P/S way down as well. Typically, we'd caution against reading too much into price-to-sales ratios when settling on investment decisions, though it can reveal plenty about what other market participants think about the company.
We're very surprised to see Ocean GeoLoop currently trading on a much lower than expected P/S since its recent three-year growth is higher than the wider industry forecast. When we see strong revenue with faster-than-industry growth, we assume there are some significant underlying risks to the company's ability to make money which is applying downwards pressure on the P/S ratio. At least price risks look to be very low if recent medium-term revenue trends continue, but investors seem to think future revenue could see a lot of volatility.
Having said that, be aware Ocean GeoLoop is showing 2 warning signs in our investment analysis, and 1 of those shouldn't be ignored.
If companies with solid past earnings growth is up your alley, you may wish to see this free collection of other companies with strong earnings growth and low P/E ratios.
New: AI Stock Screener & Alerts
Our new AI Stock Screener scans the market every day to uncover opportunities.
• Dividend Powerhouses (3%+ Yield)
• Undervalued Small Caps with Insider Buying
• High growth Tech and AI Companies
Or build your own from over 50 metrics.
Have feedback on this article? Concerned about the content? Get in touch with us directly. Alternatively, email editorial-team (at) simplywallst.com.
This article by Simply Wall St is general in nature. We provide commentary based on historical data and analyst forecasts only using an unbiased methodology and our articles are not intended to be financial advice. It does not constitute a recommendation to buy or sell any stock, and does not take account of your objectives, or your financial situation. We aim to bring you long-term focused analysis driven by fundamental data. Note that our analysis may not factor in the latest price-sensitive company announcements or qualitative material. Simply Wall St has no position in any stocks mentioned.
About OB:OCEAN
Ocean GeoLoop
A green tech company, develops point source carbon capture in Norway.
Slight risk with mediocre balance sheet.
Market Insights

Advertisement
Community Narratives
A formidable player in AI and enterprise computing.
Fair Value US$210.00|12.2% overvalued
CO
Community Contributor
IREN's Bold Moves in Sustainable Bitcoin Mining & AI Data Centers
Fair Value US$72.52|17.1% undervalued
BL
Community Contributor
Cooling the Champions: The Aussie Tech Behind F1's Victories
Fair Value AU$12.40|38.7% undervalued
TR
Community Contributor