
As European markets navigate the complexities of trade deals and economic data, the pan-European STOXX Europe 600 Index recently experienced a decline, reflecting investor sentiment amid an uncertain global trade environment. Despite these challenges, dividend stocks in Europe continue to attract attention for their potential to provide steady income streams; a key consideration for investors seeking stability in a fluctuating market.
Top 10 Dividend Stocks In Europe
| Name | Dividend Yield | Dividend Rating |
| Zurich Insurance Group (SWX:ZURN) | 4.49% | ★★★★★★ |
| Rubis (ENXTPA:RUI) | 7.39% | ★★★★★★ |
| OVB Holding (XTRA:O4B) | 4.59% | ★★★★★★ |
| Holcim (SWX:HOLN) | 4.77% | ★★★★★★ |
| HEXPOL (OM:HPOL B) | 5.08% | ★★★★★★ |
| DKSH Holding (SWX:DKSH) | 4.15% | ★★★★★★ |
| Deutsche Post (XTRA:DHL) | 4.83% | ★★★★★★ |
| Cembra Money Bank (SWX:CMBN) | 4.65% | ★★★★★★ |
| Banque Cantonale Vaudoise (SWX:BCVN) | 4.67% | ★★★★★★ |
| Allianz (XTRA:ALV) | 4.61% | ★★★★★★ |
Click here to see the full list of 222 stocks from our Top European Dividend Stocks screener.
Below we spotlight a couple of our favorites from our exclusive screener.
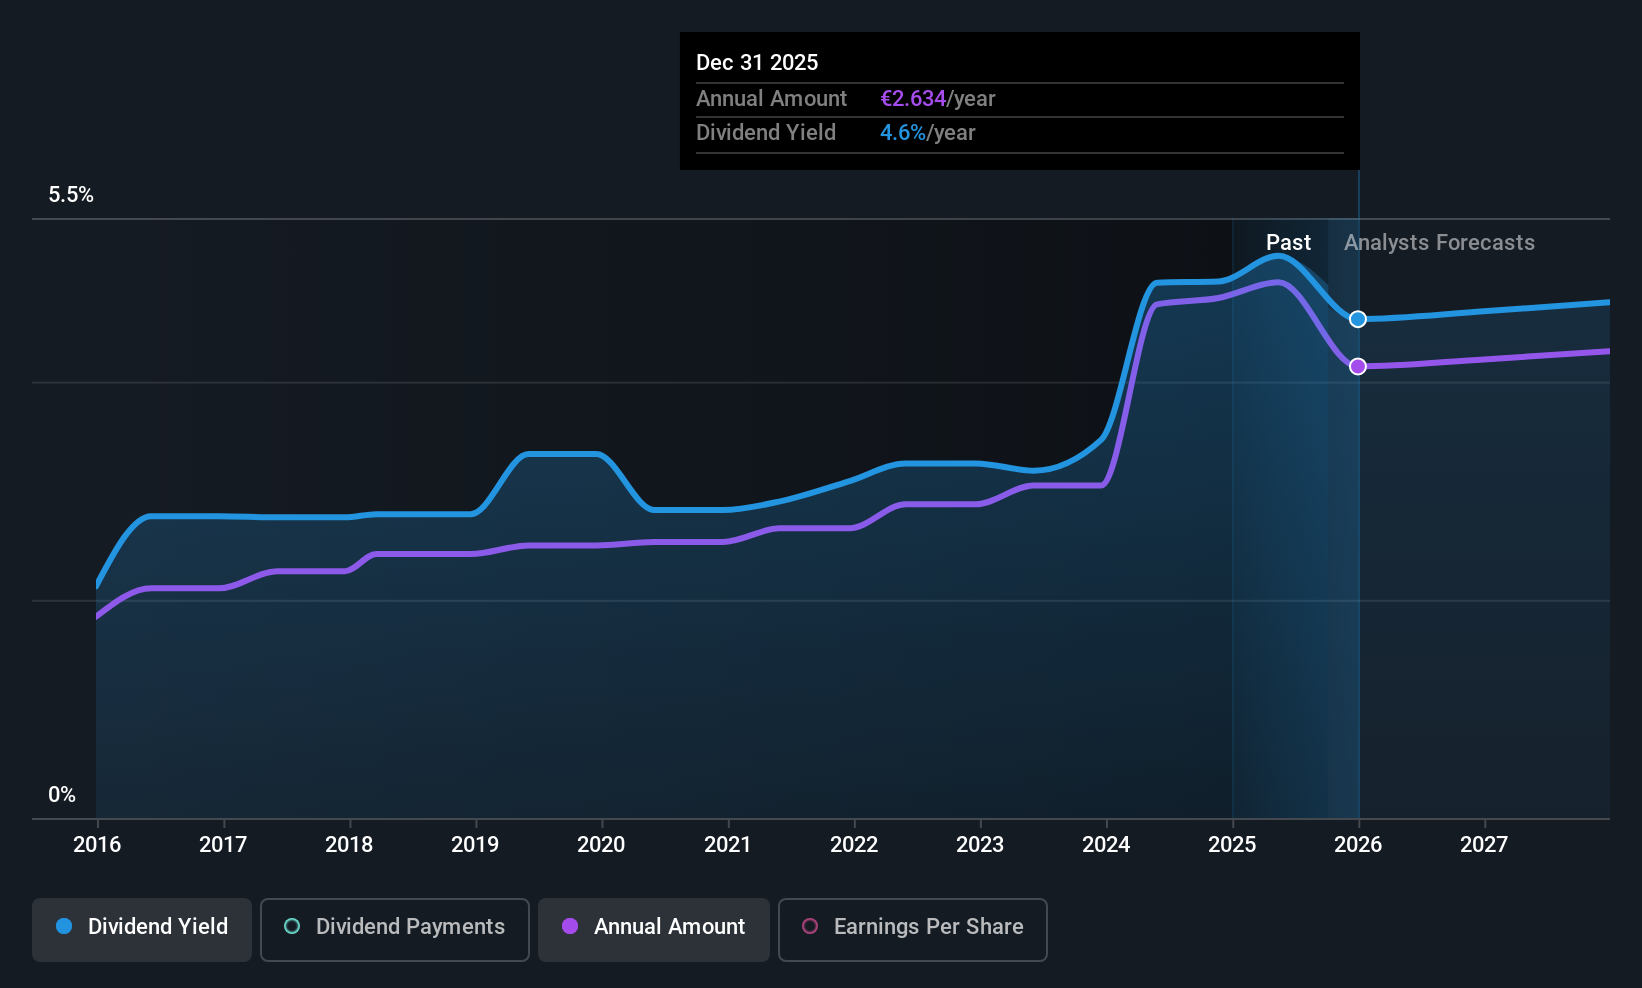
Viscofan (BME:VIS)
Simply Wall St Dividend Rating: ★★★★★☆
Overview: Viscofan, S.A., along with its subsidiaries, is engaged in the manufacturing, production, and distribution of casings and has a market cap of approximately €2.79 billion.
Operations: Viscofan, S.A. generates its revenue primarily from the wrapping segment, amounting to €1.23 billion.
Dividend Yield: 5.1%
Viscofan's dividend yield is among the top 25% in Spain, yet its sustainability is a concern due to cash flow coverage issues. The company's dividends have been stable and growing over the past decade, supported by a low payout ratio of 49.1%. However, earnings growth of 5.2% annually suggests potential for future increases. Recent earnings reports show modest sales and net income growth, indicating resilience but also highlighting challenges in covering dividends with free cash flow.
- Delve into the full analysis dividend report here for a deeper understanding of Viscofan.
- Our valuation report unveils the possibility Viscofan's shares may be trading at a discount.
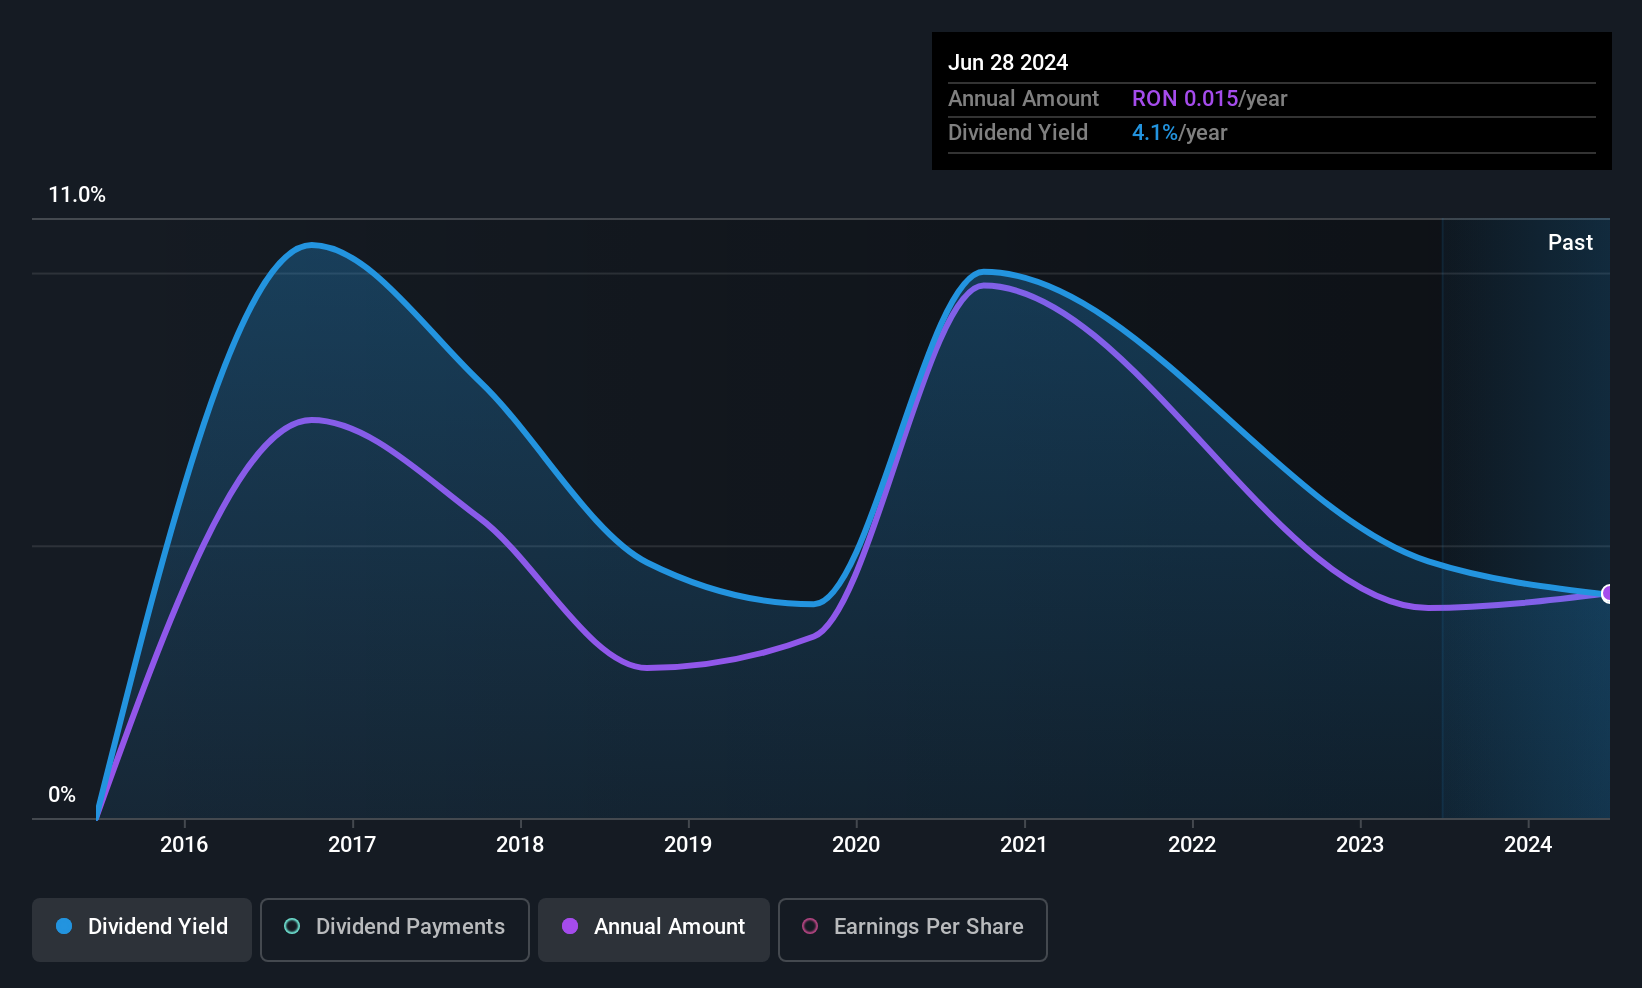
Transilvania Investments Alliance (BVB:TRANSI)
Simply Wall St Dividend Rating: ★★★★☆☆
Overview: Transilvania Investments Alliance S.A. is a closed-ended financial investment company with a market cap of RON827.53 million.
Operations: Transilvania Investments Alliance S.A. generates revenue primarily from its financial services segment, specifically through closed-end funds, amounting to RON104.84 million.
Dividend Yield: 3.8%
Transilvania Investments Alliance offers a mixed dividend profile with a low payout ratio of 45.5%, ensuring dividends are covered by earnings and cash flows (66.6% cash payout). However, its dividend yield of 3.84% lags behind the top Romanian payers at 6.37%, and payments have been volatile over the past decade. Recent earnings show significant growth, with Q1 net income rising to RON 38.99 million from RON 16.69 million, potentially supporting future stability in payouts.
- Navigate through the intricacies of Transilvania Investments Alliance with our comprehensive dividend report here.
- According our valuation report, there's an indication that Transilvania Investments Alliance's share price might be on the expensive side.
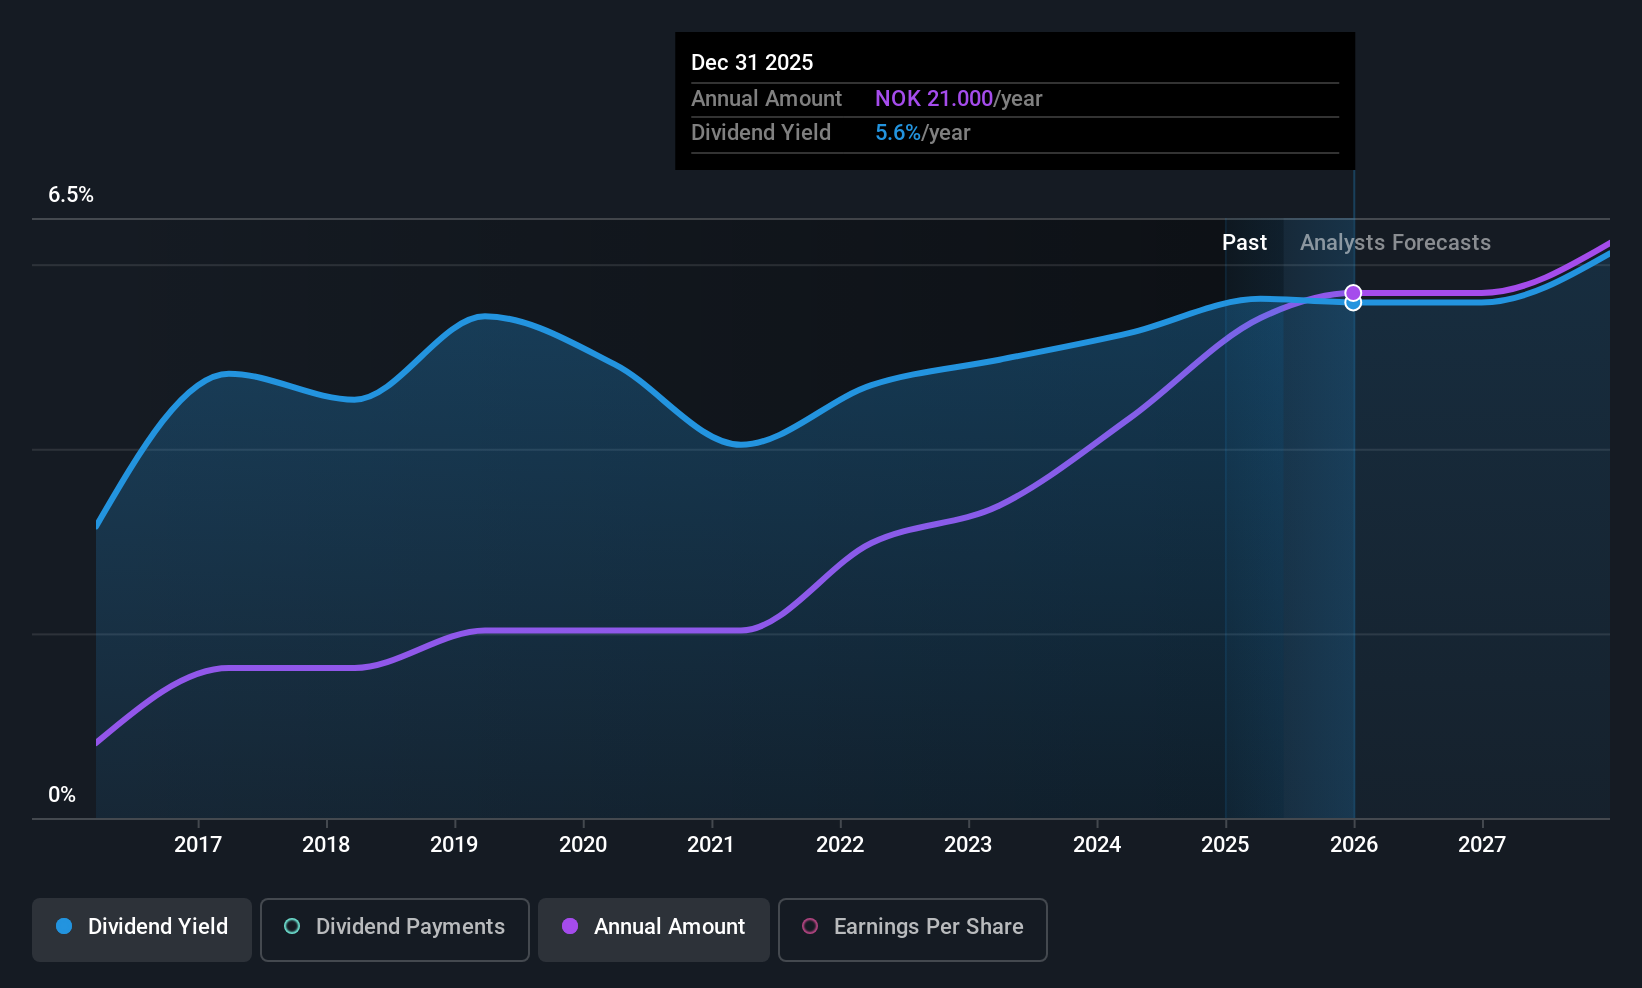
Jæren Sparebank (OB:JAREN)
Simply Wall St Dividend Rating: ★★★★☆☆
Overview: Jæren Sparebank provides a range of financial products and services to individuals and businesses in Norway, with a market cap of NOK1.80 billion.
Operations: Jæren Sparebank generates revenue through its Retail Market segment, which contributes NOK279.51 million, and its Corporate Market segment, which adds NOK168.49 million.
Dividend Yield: 5.5%
Jæren Sparebank's dividend profile shows a covered payout ratio of 73.1%, with future projections indicating continued coverage at 67.6%. Despite a decade-long increase in dividends, the payments have been unreliable and volatile. The current yield of 5.48% is below Norway's top tier, while the stock trades at a significant discount to its estimated fair value. Recent earnings revealed slight declines in net interest income and net income compared to last year, potentially impacting future stability.
- Click here and access our complete dividend analysis report to understand the dynamics of Jæren Sparebank.
- Our valuation report unveils the possibility Jæren Sparebank's shares may be trading at a premium.
Taking Advantage
- Access the full spectrum of 222 Top European Dividend Stocks by clicking on this link.
- Are these companies part of your investment strategy? Use Simply Wall St to consolidate your holdings into a portfolio and gain insights with our comprehensive analysis tools.
- Simply Wall St is a revolutionary app designed for long-term stock investors, it's free and covers every market in the world.
Ready For A Different Approach?
- Explore high-performing small cap companies that haven't yet garnered significant analyst attention.
- Fuel your portfolio with companies showing strong growth potential, backed by optimistic outlooks both from analysts and management.
- Find companies with promising cash flow potential yet trading below their fair value.
This article by Simply Wall St is general in nature. We provide commentary based on historical data and analyst forecasts only using an unbiased methodology and our articles are not intended to be financial advice. It does not constitute a recommendation to buy or sell any stock, and does not take account of your objectives, or your financial situation. We aim to bring you long-term focused analysis driven by fundamental data. Note that our analysis may not factor in the latest price-sensitive company announcements or qualitative material. Simply Wall St has no position in any stocks mentioned.
The New Payments ETF Is Live on NASDAQ:
Money is moving to real-time rails, and a newly listed ETF now gives investors direct exposure. Fast settlement. Institutional custody. Simple access.
Explore how this launch could reshape portfolios
Sponsored ContentNew: Manage All Your Stock Portfolios in One Place
We've created the ultimate portfolio companion for stock investors, and it's free.
• Connect an unlimited number of Portfolios and see your total in one currency
• Be alerted to new Warning Signs or Risks via email or mobile
• Track the Fair Value of your stocks
Have feedback on this article? Concerned about the content? Get in touch with us directly. Alternatively, email editorial-team@simplywallst.com
About BME:VIS
Very undervalued with solid track record and pays a dividend.
Market Insights

Weekly Picks

THE KINGDOM OF BROWN GOODS: WHY MGPI IS BEING CRUSHED BY INVENTORY & PRIMED FOR RESURRECTION


Why Vertical Aerospace (NYSE: EVTL) is Worth Possibly Over 13x its Current Price


The Quiet Giant That Became AI’s Power Grid
Recently Updated Narratives


MINISO's fair value is projected at 26.69 with an anticipated PE ratio shift of 20x

Fiverr International will transform the freelance industry with AI-powered growth

Stride Stock: Online Education Finds Its Second Act
Popular Narratives


MicroVision will explode future revenue by 380.37% with a vision towards success


Crazy Undervalued 42 Baggers Silver Play (Active & Running Mine)


