- Netherlands
- /
- Chemicals
- /
- ENXTAM:DSFIR
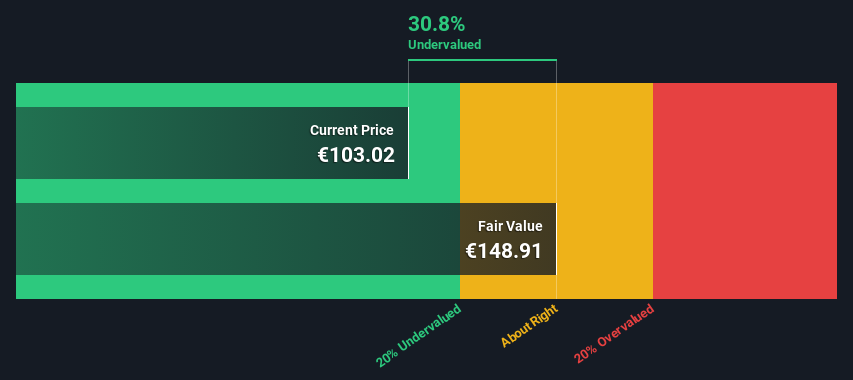
DSM-Firmenich AG (AMS:DSFIR) Shares Could Be 31% Below Their Intrinsic Value Estimate


Key Insights
- Using the 2 Stage Free Cash Flow to Equity, DSM-Firmenich fair value estimate is €149
- DSM-Firmenich's €103 share price signals that it might be 31% undervalued
- The €117 analyst price target for DSFIR is 22% less than our estimate of fair value
Today we'll do a simple run through of a valuation method used to estimate the attractiveness of DSM-Firmenich AG (AMS:DSFIR) as an investment opportunity by projecting its future cash flows and then discounting them to today's value. Our analysis will employ the Discounted Cash Flow (DCF) model. There's really not all that much to it, even though it might appear quite complex.
Companies can be valued in a lot of ways, so we would point out that a DCF is not perfect for every situation. Anyone interested in learning a bit more about intrinsic value should have a read of the Simply Wall St analysis model.
Check out our latest analysis for DSM-Firmenich
What's The Estimated Valuation?
We are going to use a two-stage DCF model, which, as the name states, takes into account two stages of growth. The first stage is generally a higher growth period which levels off heading towards the terminal value, captured in the second 'steady growth' period. To start off with, we need to estimate the next ten years of cash flows. Where possible we use analyst estimates, but when these aren't available we extrapolate the previous free cash flow (FCF) from the last estimate or reported value. We assume companies with shrinking free cash flow will slow their rate of shrinkage, and that companies with growing free cash flow will see their growth rate slow, over this period. We do this to reflect that growth tends to slow more in the early years than it does in later years.
Generally we assume that a dollar today is more valuable than a dollar in the future, so we need to discount the sum of these future cash flows to arrive at a present value estimate:
10-year free cash flow (FCF) estimate
| 2024 | 2025 | 2026 | 2027 | 2028 | 2029 | 2030 | 2031 | 2032 | 2033 | |
| Levered FCF (€, Millions) | €974.7m | €1.01b | €1.28b | €1.66b | €1.82b | €1.94b | €2.03b | €2.10b | €2.16b | €2.20b |
| Growth Rate Estimate Source | Analyst x3 | Analyst x7 | Analyst x6 | Analyst x3 | Analyst x3 | Est @ 6.38% | Est @ 4.69% | Est @ 3.51% | Est @ 2.69% | Est @ 2.11% |
| Present Value (€, Millions) Discounted @ 5.5% | €924 | €908 | €1.1k | €1.3k | €1.4k | €1.4k | €1.4k | €1.4k | €1.3k | €1.3k |
("Est" = FCF growth rate estimated by Simply Wall St)
Present Value of 10-year Cash Flow (PVCF) = €12b
The second stage is also known as Terminal Value, this is the business's cash flow after the first stage. For a number of reasons a very conservative growth rate is used that cannot exceed that of a country's GDP growth. In this case we have used the 5-year average of the 10-year government bond yield (0.8%) to estimate future growth. In the same way as with the 10-year 'growth' period, we discount future cash flows to today's value, using a cost of equity of 5.5%.
Terminal Value (TV)= FCF2033 × (1 + g) ÷ (r – g) = €2.2b× (1 + 0.8%) ÷ (5.5%– 0.8%) = €46b
Present Value of Terminal Value (PVTV)= TV / (1 + r)10= €46b÷ ( 1 + 5.5%)10= €27b
The total value is the sum of cash flows for the next ten years plus the discounted terminal value, which results in the Total Equity Value, which in this case is €40b. To get the intrinsic value per share, we divide this by the total number of shares outstanding. Relative to the current share price of €103, the company appears quite good value at a 31% discount to where the stock price trades currently. The assumptions in any calculation have a big impact on the valuation, so it is better to view this as a rough estimate, not precise down to the last cent.
Important Assumptions
Now the most important inputs to a discounted cash flow are the discount rate, and of course, the actual cash flows. Part of investing is coming up with your own evaluation of a company's future performance, so try the calculation yourself and check your own assumptions. The DCF also does not consider the possible cyclicality of an industry, or a company's future capital requirements, so it does not give a full picture of a company's potential performance. Given that we are looking at DSM-Firmenich as potential shareholders, the cost of equity is used as the discount rate, rather than the cost of capital (or weighted average cost of capital, WACC) which accounts for debt. In this calculation we've used 5.5%, which is based on a levered beta of 1.037. Beta is a measure of a stock's volatility, compared to the market as a whole. We get our beta from the industry average beta of globally comparable companies, with an imposed limit between 0.8 and 2.0, which is a reasonable range for a stable business.
SWOT Analysis for DSM-Firmenich
- Debt is not viewed as a risk.
- Dividend is low compared to the top 25% of dividend payers in the Chemicals market.
- Shareholders have been diluted in the past year.
- Expected to breakeven next year.
- Has sufficient cash runway for more than 3 years based on current free cash flows.
- Trading below our estimate of fair value by more than 20%.
- Dividends are not covered by cash flow.
Looking Ahead:
Although the valuation of a company is important, it is only one of many factors that you need to assess for a company. DCF models are not the be-all and end-all of investment valuation. Instead the best use for a DCF model is to test certain assumptions and theories to see if they would lead to the company being undervalued or overvalued. For instance, if the terminal value growth rate is adjusted slightly, it can dramatically alter the overall result. What is the reason for the share price sitting below the intrinsic value? For DSM-Firmenich, there are three fundamental factors you should consider:
- Risks: Take risks, for example - DSM-Firmenich has 2 warning signs we think you should be aware of.
- Future Earnings: How does DSFIR's growth rate compare to its peers and the wider market? Dig deeper into the analyst consensus number for the upcoming years by interacting with our free analyst growth expectation chart.
- Other Solid Businesses: Low debt, high returns on equity and good past performance are fundamental to a strong business. Why not explore our interactive list of stocks with solid business fundamentals to see if there are other companies you may not have considered!
PS. The Simply Wall St app conducts a discounted cash flow valuation for every stock on the ENXTAM every day. If you want to find the calculation for other stocks just search here.
New: Manage All Your Stock Portfolios in One Place
We've created the ultimate portfolio companion for stock investors, and it's free.
• Connect an unlimited number of Portfolios and see your total in one currency
• Be alerted to new Warning Signs or Risks via email or mobile
• Track the Fair Value of your stocks
Have feedback on this article? Concerned about the content? Get in touch with us directly. Alternatively, email editorial-team (at) simplywallst.com.
This article by Simply Wall St is general in nature. We provide commentary based on historical data and analyst forecasts only using an unbiased methodology and our articles are not intended to be financial advice. It does not constitute a recommendation to buy or sell any stock, and does not take account of your objectives, or your financial situation. We aim to bring you long-term focused analysis driven by fundamental data. Note that our analysis may not factor in the latest price-sensitive company announcements or qualitative material. Simply Wall St has no position in any stocks mentioned.
About ENXTAM:DSFIR
DSM-Firmenich
Provides solutions for nutrition, health, and beauty businesses in the Switzerland, Netherlands, rest of Europe, the Middle East and Africa, North America, Latin America, China, and rest of Asia.
Excellent balance sheet and good value.
