- Netherlands
- /
- Banks
- /
- ENXTAM:ABN
Investing in ABN AMRO Bank (AMS:ABN) three years ago would have delivered you a 89% gain


By buying an index fund, investors can approximate the average market return. But if you buy good businesses at attractive prices, your portfolio returns could exceed the average market return. For example, the ABN AMRO Bank N.V. (AMS:ABN) share price is up 51% in the last three years, clearly besting the market return of around 16% (not including dividends).
Now it's worth having a look at the company's fundamentals too, because that will help us determine if the long term shareholder return has matched the performance of the underlying business.
View our latest analysis for ABN AMRO Bank
In his essay The Superinvestors of Graham-and-Doddsville Warren Buffett described how share prices do not always rationally reflect the value of a business. One imperfect but simple way to consider how the market perception of a company has shifted is to compare the change in the earnings per share (EPS) with the share price movement.
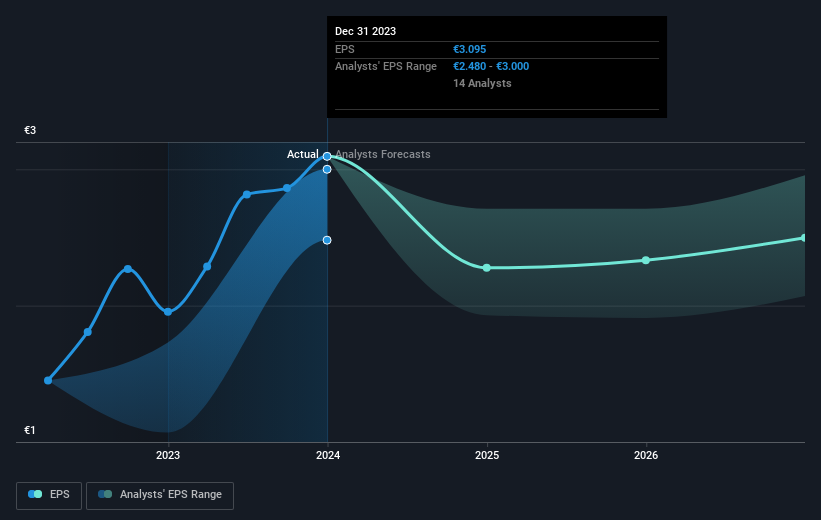
ABN AMRO Bank became profitable within the last three years. That would generally be considered a positive, so we'd expect the share price to be up.
The image below shows how EPS has tracked over time (if you click on the image you can see greater detail).
We're pleased to report that the CEO is remunerated more modestly than most CEOs at similarly capitalized companies. It's always worth keeping an eye on CEO pay, but a more important question is whether the company will grow earnings throughout the years. Dive deeper into the earnings by checking this interactive graph of ABN AMRO Bank's earnings, revenue and cash flow.
What About Dividends?
It is important to consider the total shareholder return, as well as the share price return, for any given stock. The TSR is a return calculation that accounts for the value of cash dividends (assuming that any dividend received was reinvested) and the calculated value of any discounted capital raisings and spin-offs. Arguably, the TSR gives a more comprehensive picture of the return generated by a stock. As it happens, ABN AMRO Bank's TSR for the last 3 years was 89%, which exceeds the share price return mentioned earlier. This is largely a result of its dividend payments!
A Different Perspective
Investors in ABN AMRO Bank had a tough year, with a total loss of 3.4% (including dividends), against a market gain of about 18%. Even the share prices of good stocks drop sometimes, but we want to see improvements in the fundamental metrics of a business, before getting too interested. Unfortunately, last year's performance may indicate unresolved challenges, given that it was worse than the annualised loss of 1.0% over the last half decade. We realise that Baron Rothschild has said investors should "buy when there is blood on the streets", but we caution that investors should first be sure they are buying a high quality business. It's always interesting to track share price performance over the longer term. But to understand ABN AMRO Bank better, we need to consider many other factors. Like risks, for instance. Every company has them, and we've spotted 2 warning signs for ABN AMRO Bank (of which 1 doesn't sit too well with us!) you should know about.
If you are like me, then you will not want to miss this free list of growing companies that insiders are buying.
Please note, the market returns quoted in this article reflect the market weighted average returns of stocks that currently trade on Dutch exchanges.
New: Manage All Your Stock Portfolios in One Place
We've created the ultimate portfolio companion for stock investors, and it's free.
• Connect an unlimited number of Portfolios and see your total in one currency
• Be alerted to new Warning Signs or Risks via email or mobile
• Track the Fair Value of your stocks
Have feedback on this article? Concerned about the content? Get in touch with us directly. Alternatively, email editorial-team (at) simplywallst.com.
This article by Simply Wall St is general in nature. We provide commentary based on historical data and analyst forecasts only using an unbiased methodology and our articles are not intended to be financial advice. It does not constitute a recommendation to buy or sell any stock, and does not take account of your objectives, or your financial situation. We aim to bring you long-term focused analysis driven by fundamental data. Note that our analysis may not factor in the latest price-sensitive company announcements or qualitative material. Simply Wall St has no position in any stocks mentioned.
About ENXTAM:ABN
ABN AMRO Bank
Provides various banking products and financial services to retail, private, and business clients in the Netherlands and internationally.
Undervalued with excellent balance sheet and pays a dividend.
Similar Companies
Market Insights

Community Narratives


