- Malaysia
- /
- Marine and Shipping
- /
- KLSE:FM
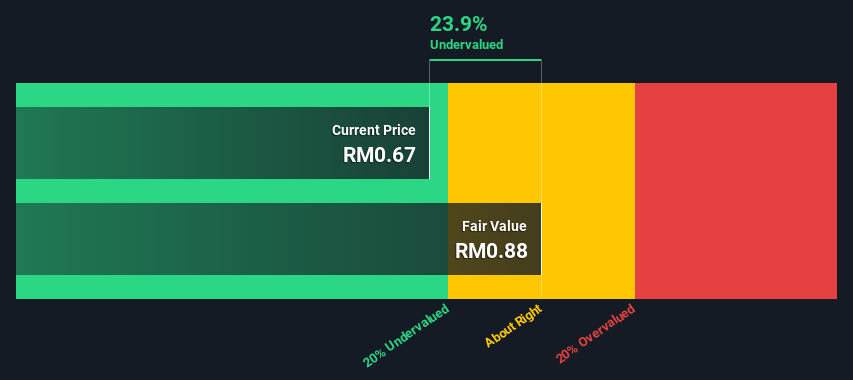
Freight Management Holdings Bhd (KLSE:FREIGHT) Shares Could Be 24% Below Their Intrinsic Value Estimate


How far off is Freight Management Holdings Bhd (KLSE:FREIGHT) from its intrinsic value? Using the most recent financial data, we'll take a look at whether the stock is fairly priced by taking the expected future cash flows and discounting them to today's value. The Discounted Cash Flow (DCF) model is the tool we will apply to do this. There's really not all that much to it, even though it might appear quite complex.
Companies can be valued in a lot of ways, so we would point out that a DCF is not perfect for every situation. If you want to learn more about discounted cash flow, the rationale behind this calculation can be read in detail in the Simply Wall St analysis model.
Check out our latest analysis for Freight Management Holdings Bhd
Crunching the numbers
We use what is known as a 2-stage model, which simply means we have two different periods of growth rates for the company's cash flows. Generally the first stage is higher growth, and the second stage is a lower growth phase. In the first stage we need to estimate the cash flows to the business over the next ten years. Where possible we use analyst estimates, but when these aren't available we extrapolate the previous free cash flow (FCF) from the last estimate or reported value. We assume companies with shrinking free cash flow will slow their rate of shrinkage, and that companies with growing free cash flow will see their growth rate slow, over this period. We do this to reflect that growth tends to slow more in the early years than it does in later years.
A DCF is all about the idea that a dollar in the future is less valuable than a dollar today, so we discount the value of these future cash flows to their estimated value in today's dollars:
10-year free cash flow (FCF) forecast
| 2022 | 2023 | 2024 | 2025 | 2026 | 2027 | 2028 | 2029 | 2030 | 2031 | |
| Levered FCF (MYR, Millions) | RM33.8m | RM37.7m | RM36.7m | RM34.5m | RM36.0m | RM35.9m | RM36.2m | RM36.8m | RM37.6m | RM38.7m |
| Growth Rate Estimate Source | Analyst x2 | Analyst x2 | Analyst x1 | Analyst x1 | Analyst x1 | Est @ -0.31% | Est @ 0.87% | Est @ 1.69% | Est @ 2.27% | Est @ 2.68% |
| Present Value (MYR, Millions) Discounted @ 9.6% | RM30.8 | RM31.4 | RM27.9 | RM23.9 | RM22.7 | RM20.7 | RM19.0 | RM17.7 | RM16.5 | RM15.4 |
("Est" = FCF growth rate estimated by Simply Wall St)
Present Value of 10-year Cash Flow (PVCF) = RM225m
We now need to calculate the Terminal Value, which accounts for all the future cash flows after this ten year period. The Gordon Growth formula is used to calculate Terminal Value at a future annual growth rate equal to the 5-year average of the 10-year government bond yield of 3.6%. We discount the terminal cash flows to today's value at a cost of equity of 9.6%.
Terminal Value (TV)= FCF2031 × (1 + g) ÷ (r – g) = RM39m× (1 + 3.6%) ÷ (9.6%– 3.6%) = RM668m
Present Value of Terminal Value (PVTV)= TV / (1 + r)10= RM668m÷ ( 1 + 9.6%)10= RM267m
The total value, or equity value, is then the sum of the present value of the future cash flows, which in this case is RM492m. In the final step we divide the equity value by the number of shares outstanding. Compared to the current share price of RM0.7, the company appears a touch undervalued at a 24% discount to where the stock price trades currently. Remember though, that this is just an approximate valuation, and like any complex formula - garbage in, garbage out.
The assumptions
Now the most important inputs to a discounted cash flow are the discount rate, and of course, the actual cash flows. If you don't agree with these result, have a go at the calculation yourself and play with the assumptions. The DCF also does not consider the possible cyclicality of an industry, or a company's future capital requirements, so it does not give a full picture of a company's potential performance. Given that we are looking at Freight Management Holdings Bhd as potential shareholders, the cost of equity is used as the discount rate, rather than the cost of capital (or weighted average cost of capital, WACC) which accounts for debt. In this calculation we've used 9.6%, which is based on a levered beta of 1.020. Beta is a measure of a stock's volatility, compared to the market as a whole. We get our beta from the industry average beta of globally comparable companies, with an imposed limit between 0.8 and 2.0, which is a reasonable range for a stable business.
Moving On:
Whilst important, the DCF calculation is only one of many factors that you need to assess for a company. The DCF model is not a perfect stock valuation tool. Rather it should be seen as a guide to "what assumptions need to be true for this stock to be under/overvalued?" For instance, if the terminal value growth rate is adjusted slightly, it can dramatically alter the overall result. What is the reason for the share price sitting below the intrinsic value? For Freight Management Holdings Bhd, we've put together three additional aspects you should explore:
- Risks: Case in point, we've spotted 3 warning signs for Freight Management Holdings Bhd you should be aware of.
- Future Earnings: How does FREIGHT's growth rate compare to its peers and the wider market? Dig deeper into the analyst consensus number for the upcoming years by interacting with our free analyst growth expectation chart.
- Other Solid Businesses: Low debt, high returns on equity and good past performance are fundamental to a strong business. Why not explore our interactive list of stocks with solid business fundamentals to see if there are other companies you may not have considered!
PS. The Simply Wall St app conducts a discounted cash flow valuation for every stock on the KLSE every day. If you want to find the calculation for other stocks just search here.
If you're looking for stocks to buy, use the lowest-cost* platform that is rated #1 Overall by Barron’s, Interactive Brokers. Trade stocks, options, futures, forex, bonds and funds on 135 markets, all from a single integrated account. Promoted
New: AI Stock Screener & Alerts
Our new AI Stock Screener scans the market every day to uncover opportunities.
• Dividend Powerhouses (3%+ Yield)
• Undervalued Small Caps with Insider Buying
• High growth Tech and AI Companies
Or build your own from over 50 metrics.
This article by Simply Wall St is general in nature. It does not constitute a recommendation to buy or sell any stock, and does not take account of your objectives, or your financial situation. We aim to bring you long-term focused analysis driven by fundamental data. Note that our analysis may not factor in the latest price-sensitive company announcements or qualitative material. Simply Wall St has no position in any stocks mentioned.
*Interactive Brokers Rated Lowest Cost Broker by StockBrokers.com Annual Online Review 2020
Have feedback on this article? Concerned about the content? Get in touch with us directly. Alternatively, email editorial-team (at) simplywallst.com.
About KLSE:FM
FM Global Logistics Holdings Berhad
Provides international multi-modal freight services in Malaysia, Thailand, Indonesia, Vietnam, India, Australia, the Philippines, Singapore, and the United States.
Excellent balance sheet established dividend payer.
Market Insights

Community Narratives


